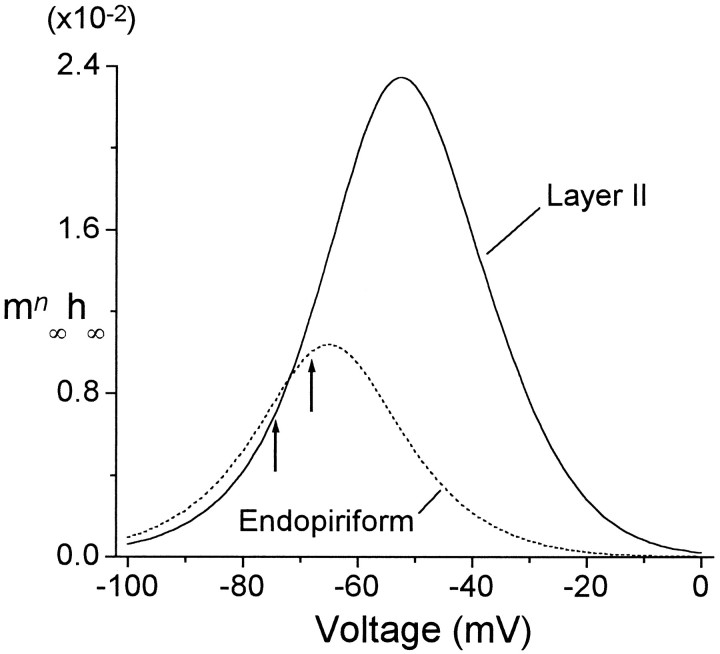
Fig. 7.
mn∞(V) · h∞(V) in LII and EN. The product of the best-fitting activation and inactivation functions from Figures 5C and 6C are shown for LII (solid line) and EN (dashed line) to give the steady-state fraction of active IA channels. Resting potentials are indicated (arrows) on the respective curves for LII (−74 mV) and EN (−68 mV). Resting potential values are fromTseng and Haberly (1989b).

