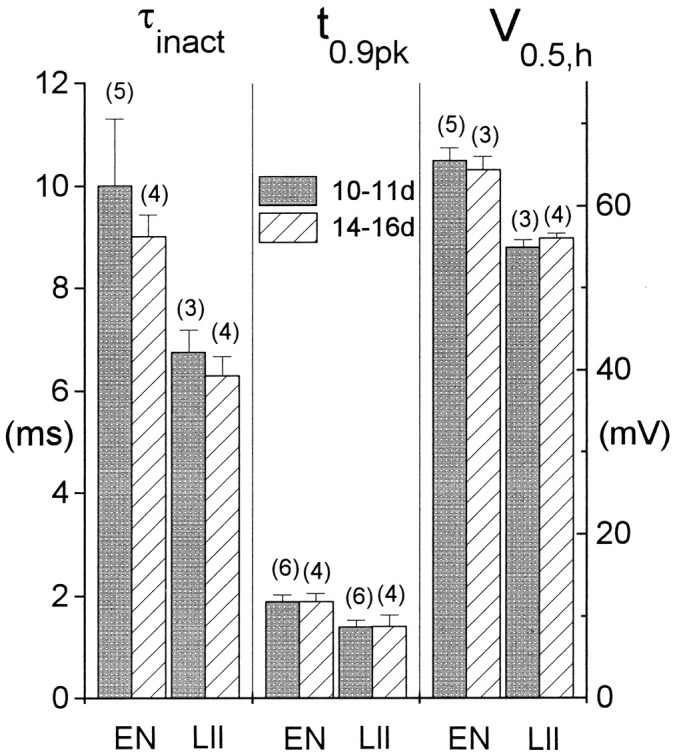
Fig. 9.

Properties of high-threshold K currents in LII and EN. A, Current–voltage relationships derived from responses at the end of 200 msec depolarizing voltage steps from −90 mV for cells in EN (squares; n = 31) and LII (triangles; n = 16). Current was averaged over the final 5 msec of the response. Voltages were corrected for series resistance errors and the data binned at approximately equal voltage increments. Voltage within each bin was averaged. In all cases, the horizontal SE bars were smaller than the symbol size. B, Steady-state inactivation data for the slowly inactivating K current recorded from cells in EN (n = 9) and LII (n = 5). The inactivation protocol used was similar to that illustrated in Figure 1, trace b, but the conditioning pulse duration was 10 sec, and the test pulse duration was 200 msec. Boltzmann fit parameters are LII: V0.5 = −57.0 ± 6.8 mV, k = 11.0 ± 2.8 mV; EN: V0.5 = −55.2 ± 3.9 mV, k = 11.2 ± 2.1 mV.
