Fig. 7.
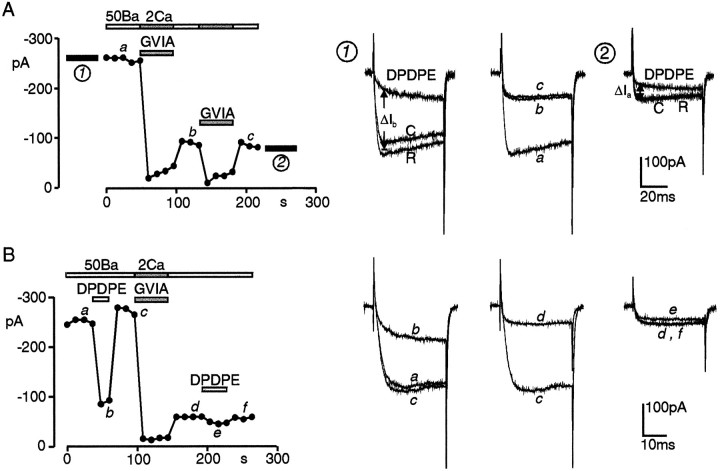
ω-CTx–GVIA removes a large proportion of DPDPE inhibition in nifedipine-treated cells. A, Comparison of 0.3 μm DPDPE action before (1) and after (2) two acute applications of 3 μmω-CTx in 2 mm Ca2+. On the left diagram, the dots represent peak Ba2+ currents recorded at +30 mV every 12 sec from Vh −90 mV. All bath solutions contained 3 μm nifedipine. Lower bars mark the time of toxin application (shadowed bars) and the interval in which DPDPE action was tested (filled bars). Upper bars indicate the Ba2+ and Ca2+concentrations of external solutions (in mm). On the right are the current traces recorded at the times (a–c) and intervals (1, 2) labeled on the left. ΔIb and ΔIa indicate the amount of DPDPE inhibition before and after the two toxin applications. B, Same as in A, but from a cell containing a higher density of N-type channels as proven by the potent block of Ba2+ currents by ω-CTx (tracesc, d). The strong inhibitory effect of DPDPE before toxin application (traces a–c) is partially preserved on residual ω-CTx-resistant currents.

