
Fig. 2.
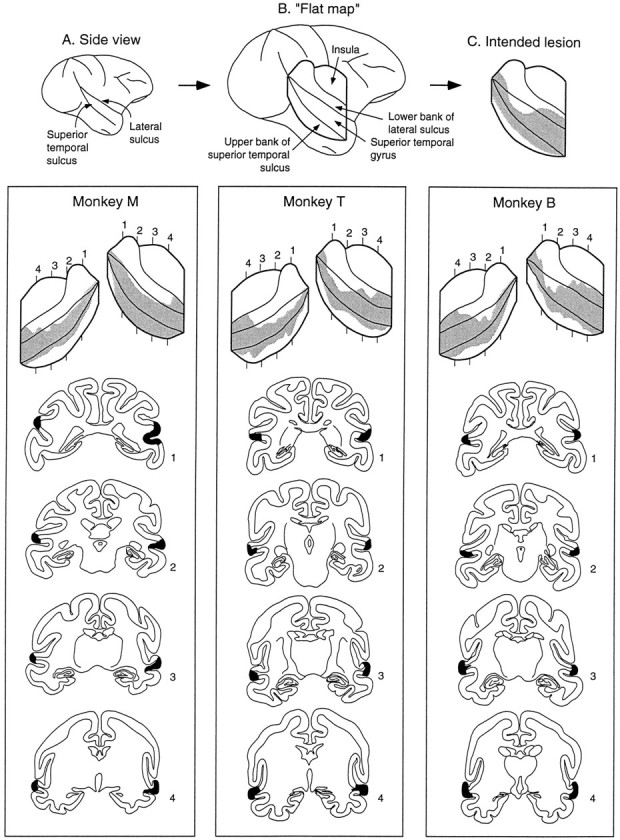
Flattened cortical reconstructions and representative cross-sections for monkeys M, T, and B. The shaded region represents the extent of the lesion. The topportion of the figure illustrates how the flattened reconstructions were generated.
Official websites use .gov
A
.gov website belongs to an official
government organization in the United States.
Secure .gov websites use HTTPS
A lock (
) or https:// means you've safely
connected to the .gov website. Share sensitive
information only on official, secure websites.
Flattened cortical reconstructions and representative cross-sections for monkeys M, T, and B. The shaded region represents the extent of the lesion. The topportion of the figure illustrates how the flattened reconstructions were generated.