
Fig. 3.
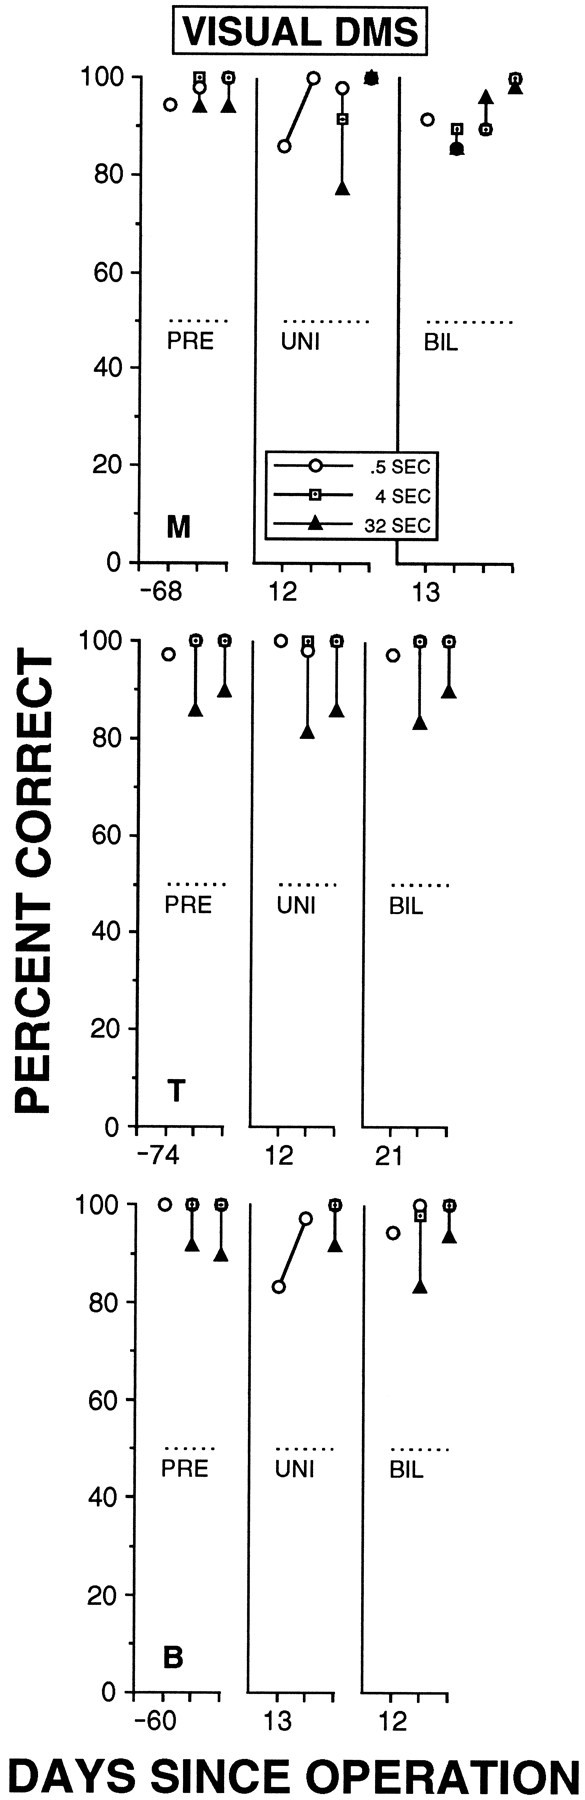
Performance on the visual DMS task preoperative (PRE) and after the first (UNI) and second (BIL) ST cortex lesions for monkeys M (top), T (middle), and B (bottom). Baseline DMS sessions, which used delays of 0.5 sec, are represented by a single circle. Retention DMS sessions, which used delays of 0.5, 4, and 32 sec, are represented by three symbols (circle,square, and triangle) connected by a vertical line. Each baseline DMS session is based on 1 d of testing, whereas each retention DMS session is based on the average performance over 4 d of testing. Shown at the bottom are the number of days after each operation when testing was initiated. The preoperative value, representing the number of days before the first operation when testing was initiated, is shown as a negative number. The dotted line represents chance levels of performance.