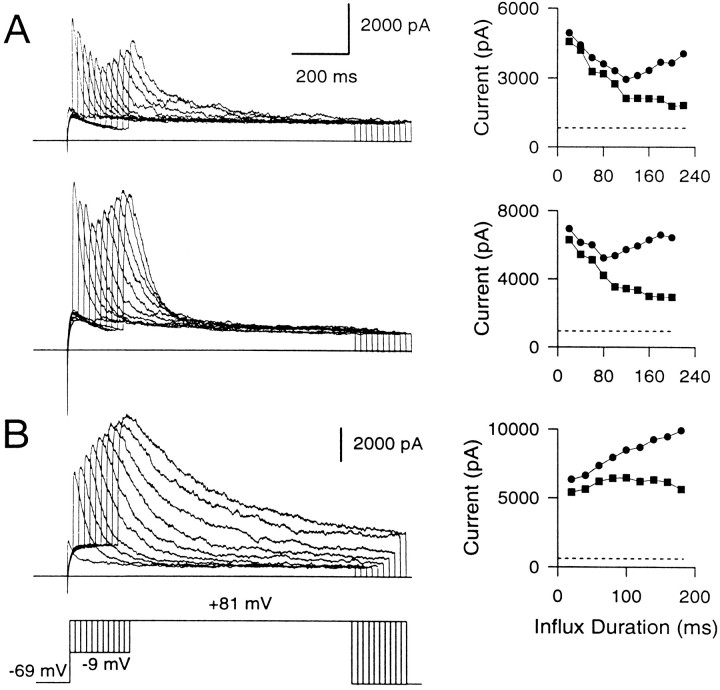
Fig. 9.
400 μm EGTA uncovers BK channels closely associated with Ca2+ channels from those at a distance. A, Two examples of BKi currents recorded in the presence of 400 μm EGTA in the cell are shown. The voltage protocol is the same as that in Figure 8. Amplitudes of the peak (circles) and instantaneous (squares) currents plotted against the duration of the influx step are shown on theright. The dotted line in each case indicates the amplitude of the steady-state Ca2+-independent, voltage-dependent current in each cell. In each case, the instantaneous current becomes progressively smaller as the duration of the influx step is increased. The peak current becomes smaller in the first few influx steps but then recovers as the influx step duration is still increased. B, The behavior of BKs current with 400 μm EGTA in the cell is shown. Instantaneous current is more or less steady, and peak current increases with increasing influx duration.

