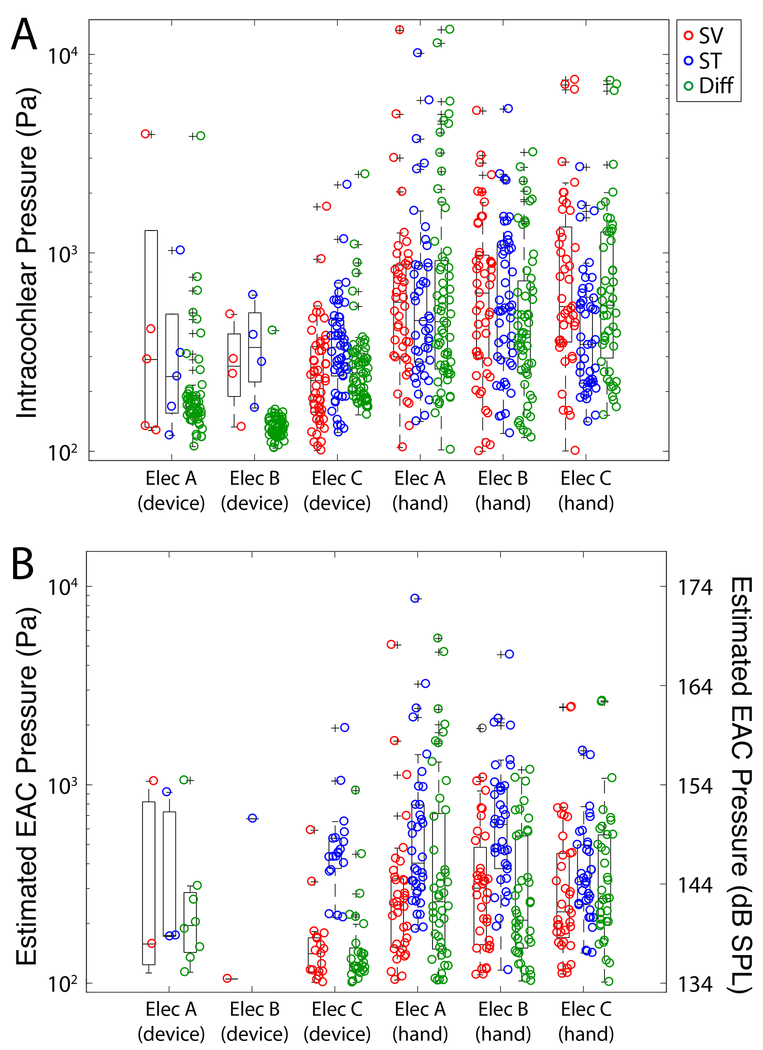
Figure 5:
Summary of peak sound pressure levels by electrode type. Unfiltered peak intracochlear pressure measurements (A) and estimated EAC pressures (B) are shown for each pressure recording as a function of electrode type. Box plots represent the median +/−25% of the range of pressures observed, whiskers show the full range of the estimated distribution, and +’s mark outliers. No significant differences between groups were noted.

