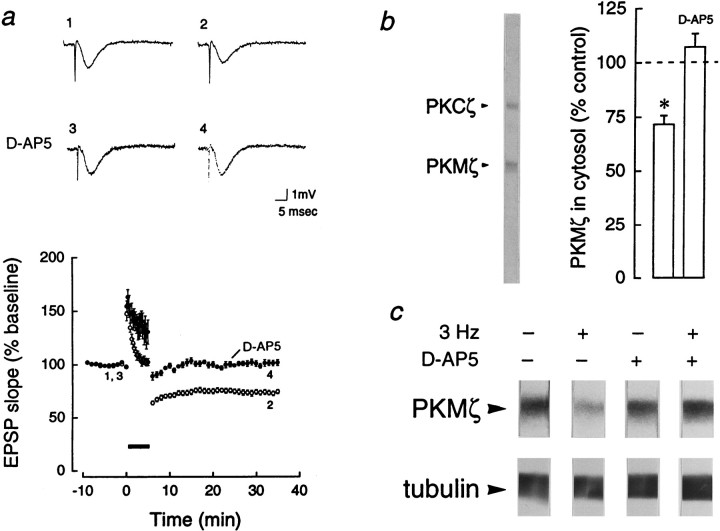
Fig. 4.
NMDA receptor-dependent downregulation of PKMζ in LTD. a, Top, Representative field EPSP traces before (traces 1, 3) and 30 min after (traces 2, 4) 3 Hz stimulation. The decrease in initial slope during LTD (1, 2) was blocked by bath application of the NMDA-receptor antagonistd(−)-2-amino-5-phosphonopentanoic acid (d-AP5; 50 μm; 3, 4).Bottom, LTD was maintained for 30 min (open circles, n = 12). d-AP5 blocked LTD (closed circles, n = 12).b, Left, Representative immunoblot with antiserum to ζ, showing PKCζ and PKMζ,Mr = 72 and 55 kDa, respectively.Right, Bar graph showing mean percent change of cytosolic PKMζ in CA1 regions 30 min after 3 Hz stimulation, relative to PKMζ in adjacent control CA1 regions that received only test stimulation, set at 100% (p < 0.0001, Student’s paired t test, n = 13, in which decreases were observed in all experiments). Applications ofd-AP5 blocked the decrease in PKMζ, assayed 30 min after 3 Hz stimulation (n = 6). c,Top, Immunoblots of PKMζ, representative of the experiments in b. Bottom, No changes in levels of tubulin were observed in adjacent sections of the immunoblots.

