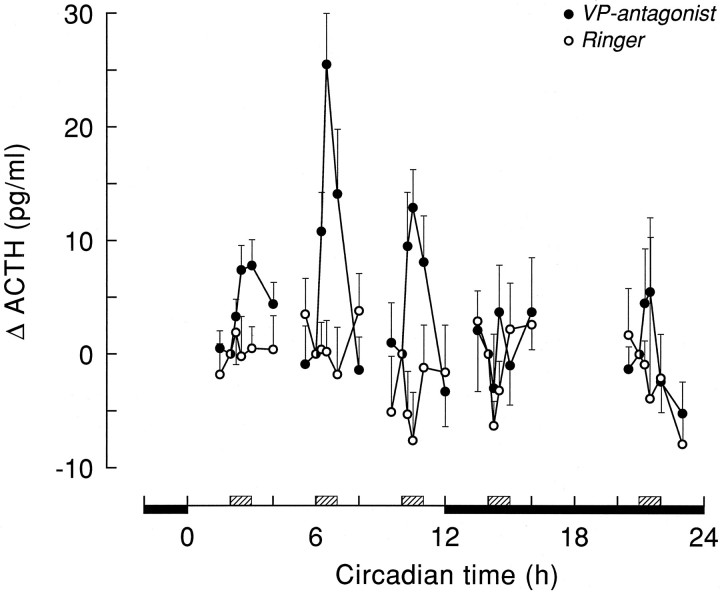
Fig. 4.
Plasma ACTH responses (mean ± SEM) during Ringer’s (○) and VP antagonist (•) administration in the PVN/DMH area. ACTH values are expressed as the difference compared witht = −1 (i.e., just before VP antagonist enters the brain). For ACTH values at t = −1, see Table 2.Hatched boxes indicate the timing of the 1 hr period of VP antagonist administration.

