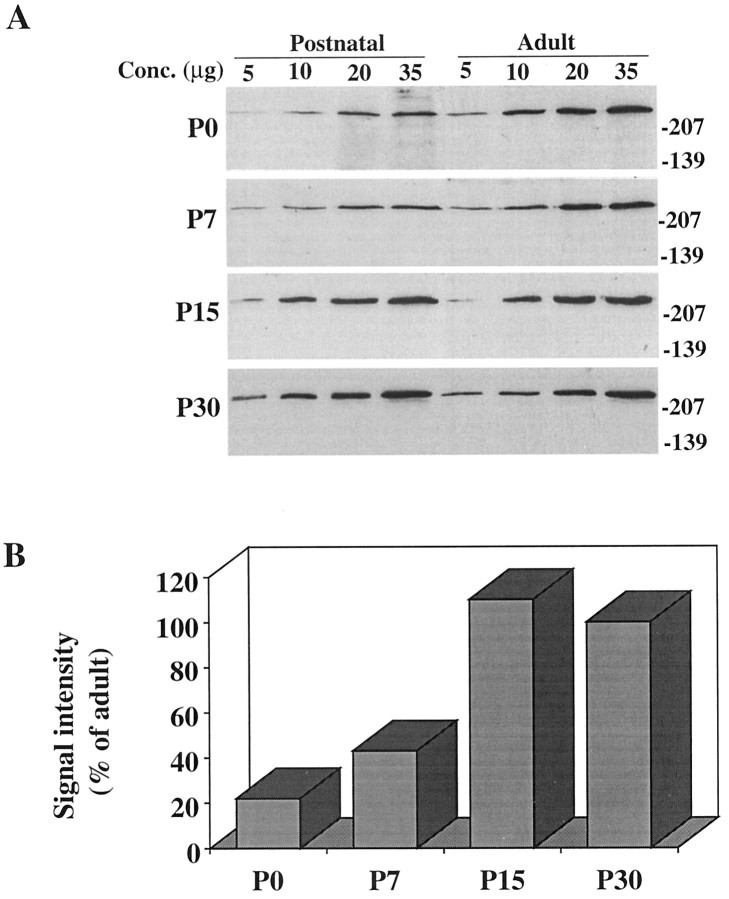
Fig. 2.
Comparison of huntingtin expression in whole-brain extracts of the postnatal and adult mouse. A, Each Western blot compares huntingtin immunoreactivity in a P0–P30 (Postnatal) and an adult animal. Different adult mice were used in each blot. Note the lower signal intensity at each protein concentration in the P0 and P7 animals relative to the adults.B, Signal intensity of huntingtin immunoreactivity in postnatal animals relative to adult. Each bar represents the median score of all ratio values obtained in comparisons of four young animals with four adult animals. Huntingtin immunoreactivity increases between P0 and P15 and shows the most marked rise between P7 and P15. P0 and P7 less than adult at p < 0.001. Molecular weight markers are shown on the right.

