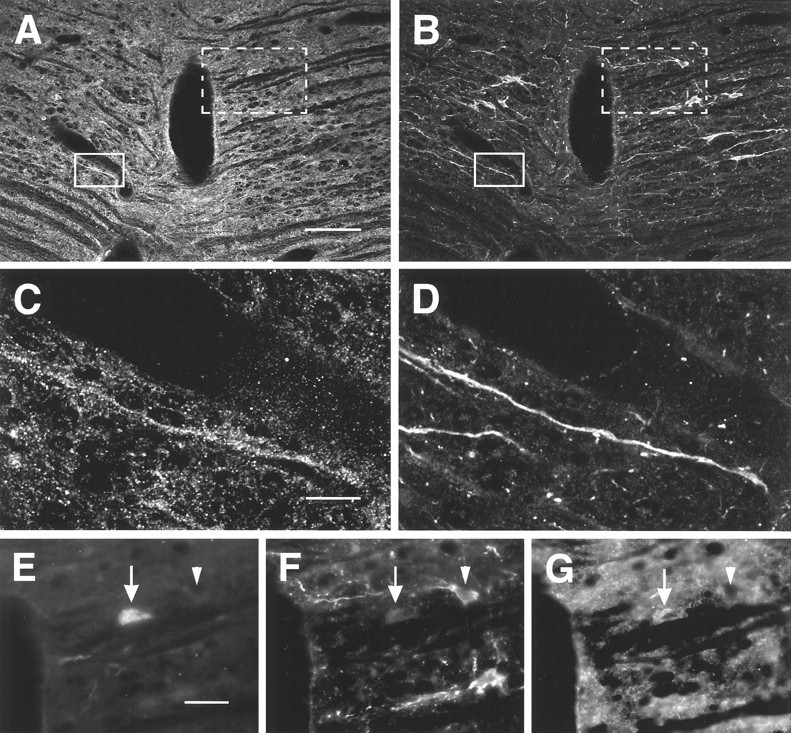
Fig. 4.

Staining of neurons in NRM for MOR1 and 5HT. Images are of a single section through NRM at the level of the caudal trapezoid body. A, B, Overview of the region examined.Solid line box marks the region shown inC and D; dotted line boxmarks the region shown in E–G. A, MOR1-ir; B, 5HT-ir; C, D, higher-magnification images of the region marked by the solid line box. Note the 5HT-ir process labeled for MOR1.E–G, Higher-magnification images of the region marked by the dotted line box. In some cases, FG-labeled cells (E) that seemed not to be immunoreactive for 5HT (F) were labeled for MOR1 (G). Scale bars: A, B, 75 μm; C, D, 25 μm;E–G, 30 μm.
