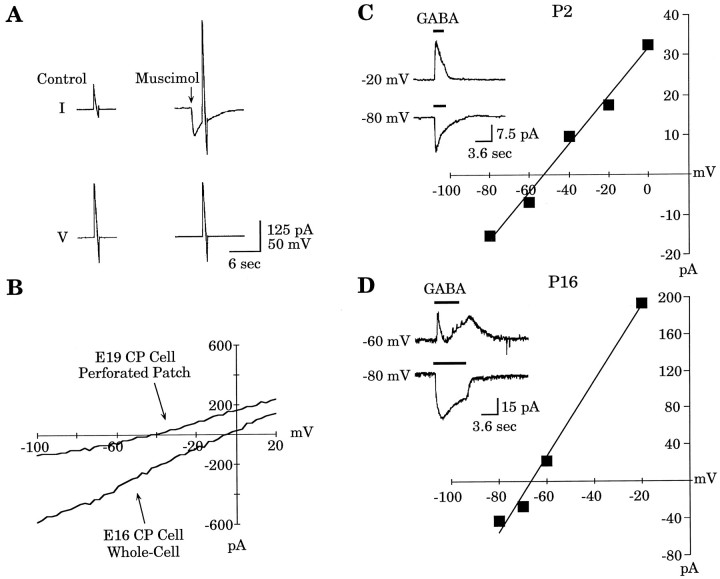
Fig. 2.
EGABAA was determined either by muscimol (30 μm) application and voltage ramps or by GABA (30 μm) application with the membrane held at a series of potentials. A, Voltage-ramp protocol applied to an E19 CP cell. B, The resultingI–V curve obtained from the recording inA after control-ramp subtraction.EGABAA is approximately −40 mV. For comparison, an I–V curve obtained from an E16 CP cell in whole-cell mode is shown. C,I–V relationship for a P2 neocortical neuron with a reversal potential of approximately −52 mV. Theinset shows the GABA-induced current at two membrane potentials. Note the monophasic response at both holding potentials.D, I–V relationship for a P16 neocortical neuron with a reversal potential of approximately −66 mV. The inset shows the GABA-induced current at two membrane potentials. Note the greater complexity of the response at the −60 mV holding potential.

