Fig. 7.
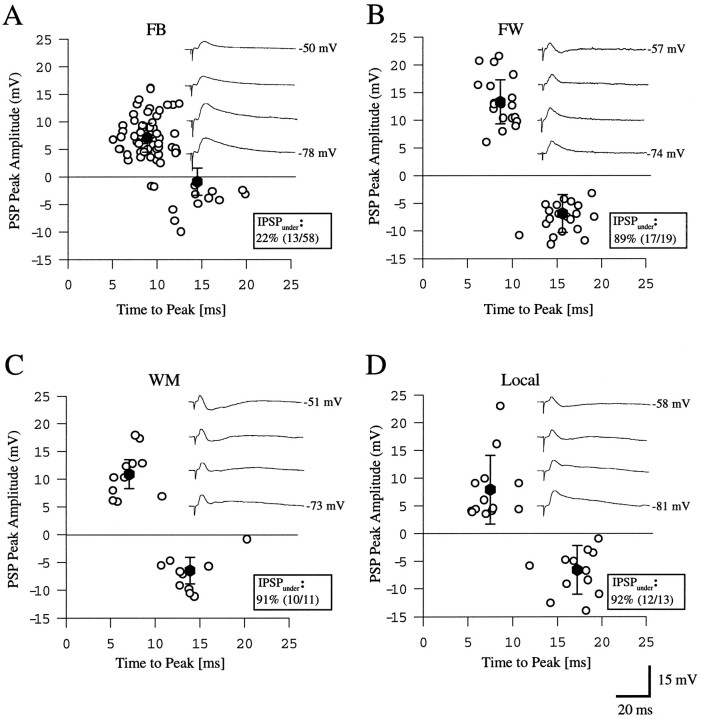
Comparison of peak amplitude of monosynaptic EPSPs (open circles above zero line) and disynaptic IPSPs (open circles below zero line) evoked by high intensity stimulation (1.9T) of different pathways providing input to layer 2/3 neurons of rat visual cortex. All measurements were performed at depolarized membrane potentials, 10–15 mV positive to the rest.Filled circles in each panel (A–D) indicate mean ± SD of EPSPs and IPSPs.IPSPunder indicates the percentage of neurons that show hyperpolarizing inhibition. Insets, Comparison of PSPs evoked in regular-spiking layer 2/3 cells of rat visual cortex at different membrane potentials in response to high intensity stimulation (1.9T) of different inputs. A, Recording in area 17. Typical feedback input from area LM, representative for 78% of the cells tested. B, Recording in area LM. Forward input from area 17. C, Stimulation in white matter below recording site in area 17. D, Input from remote location within area 17.

