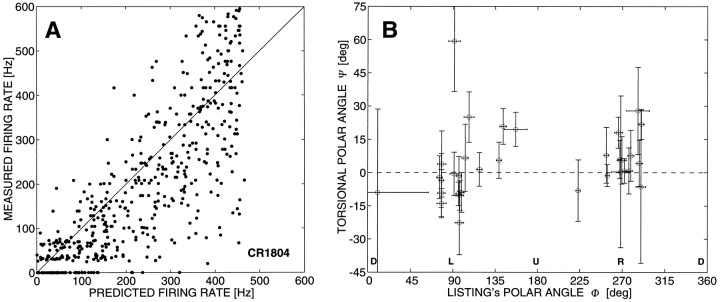
Fig. 4.
A, Result of fitting Eq. 6 to the data of cell CR1804 (see Fig. 3A and Table 1) by comparing predicted versus measured firing rate. A perfect fit would require the data to lie on the diagonal line. The correlation between predicted and measured firing rate is r = 0.82 (N = 637). Saccade amplitudes were selected between 5.7 and 11.9 deg (see Eq. 5). B, Result for all cells, in which optimal tuning directions are plotted as (φ, ψ) angles. Standard deviations were computed by bootstrapping Eq. 6 (see Materials and Methods). Note that a substantial portion of the neurons have a significant torsional on-direction (ψ ≠ 0; see also Table 1).

