Fig. 4.
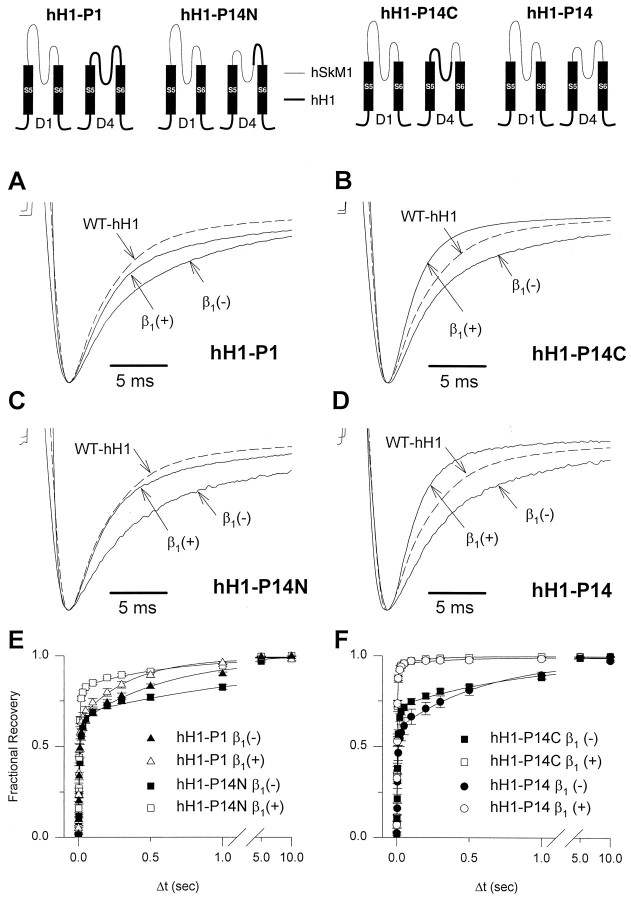
Sublocalization of the β1 subunit response element in D4/S5–S6. Chimeras used to sublocalize the β1 response structure in D4/S5–S6 (hH1–P14N, hH1–P14C) are illustrated by the drawings at the top of the figure. Drawings were simplified by showing only the S5–S6 region of D1 and D4 for each chimera. Structures from hSkM1 are indicated bythin lines, and segments from hH1 are indicated bythick lines or filled rectangles.A–D, Representative current recordings from oocytes expressing hH1–P1 (A), hH1–P14N (B), hH1–P14C (C), or hH1–P14 (D) in the presence (+) or absence (−) of hβ1. Current sweeps of wild-type hH1 (WT–hH1, dashed lines) are provided as a reference. There were no statistical differences between time constants for hH1–P1 + β1 versus hH1–P14N + β1 and between hH1–P14C + β1 versus hH1–P14 + β1. Currents were recorded using the pulse protocol described in the legend for Figure 1, and their peak currents were scaled to unity. A representative tracing from oocytes expressing wild-type hH1 in the absence of hβ1 is shown in each figure part for comparison. E, F, Recovery from inactivation was determined as described in the legend for Figure 3 and plotted against a loga- rithmic time scale.E, Recovery curves for hH1–P14N in the presence (open squares) or absence (closed squares) of hβ1 are shown with data obtained from the hH1–P1 chimera in the presence (open triangles) or absence (closed triangles) of hβ1.F, Recovery curves for hH1–P14C in the presence (open squares) or absence (closed squares) of hβ1 are shown with data obtained from the hH1–P14 chimera in the presence (open circles) and absence (closed circles) of hβ1.

