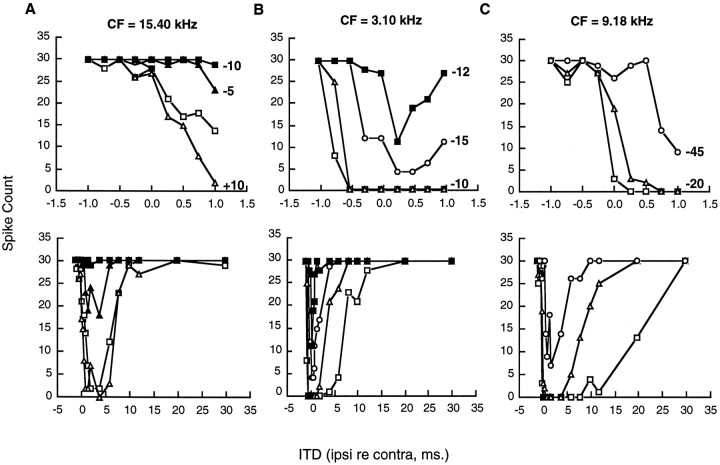
Fig. 1.
ITD curves for three neurons (A–C) in the inferior colliculus with contralaterally determined CFs of 15.40, 3.10, and 9.18 kHz. Separate ITD curves were recorded at different ipsilateral sound pressure levels (SPL) with contralateral sound pressure held constant at 20 dB above threshold (absolute values were 81, 87, and 67 dB SPL for neurons A–C, respectively). The ITD curve obtained with the ipsilateral and contralateral intensity equal is represented by open squares (IID = 0 dB). Other curves are plotted for various ipsilateral sound pressure levels above and below 0 dB, as indicated in the graph. The top three panels present data for ITD intervals between −1.0 and +1.0 msec. The bottom three panels present data from the same cells for larger ITD with ipsilateral lead times up to 30 msec. The number of spikes in this and all other figures is based on 30 stimulus presentations.

