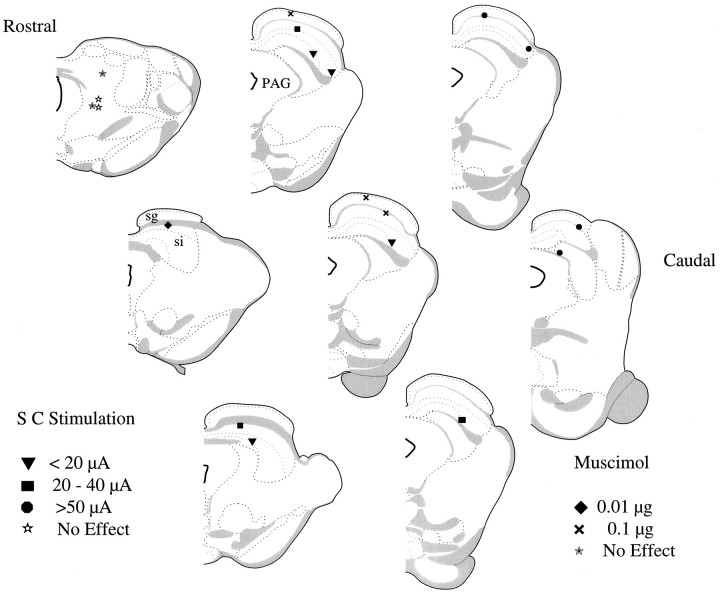
Fig. 7.
Reconstruction of the sites of muscimol microinjections and microstimulation sites in anesthetized rats. Microinjection and microstimulation sites from all animals mapped on schematic representation of coronal brain sections spaced 200 μm apart (Swanson, 1992). Filled diamonds are sites where 0.01 μg of muscimol increased blink amplitude; × are sites where 0.1 μg of muscimol increased blink amplitude. Inverted filled triangles show sites where currents <20 μA caused a 50% reduction in blink amplitude. Filled squares show sites where currents between 20 and 40 μA caused a 50% reduction in blink amplitude. Filled circles show sites requiring currents > 50 μA to cause a 50% reduction in blink amplitude.Filled stars are sites where 0.1 μg of muscimol did not alter reflex blinks. Open stars show sites where currents > 100 μA failed to alter reflex blinks.PAG, Periaqueductal gray; sg, stratum griseum superficiale; si, stratum griseum intermediale.

