
Fig. 3.
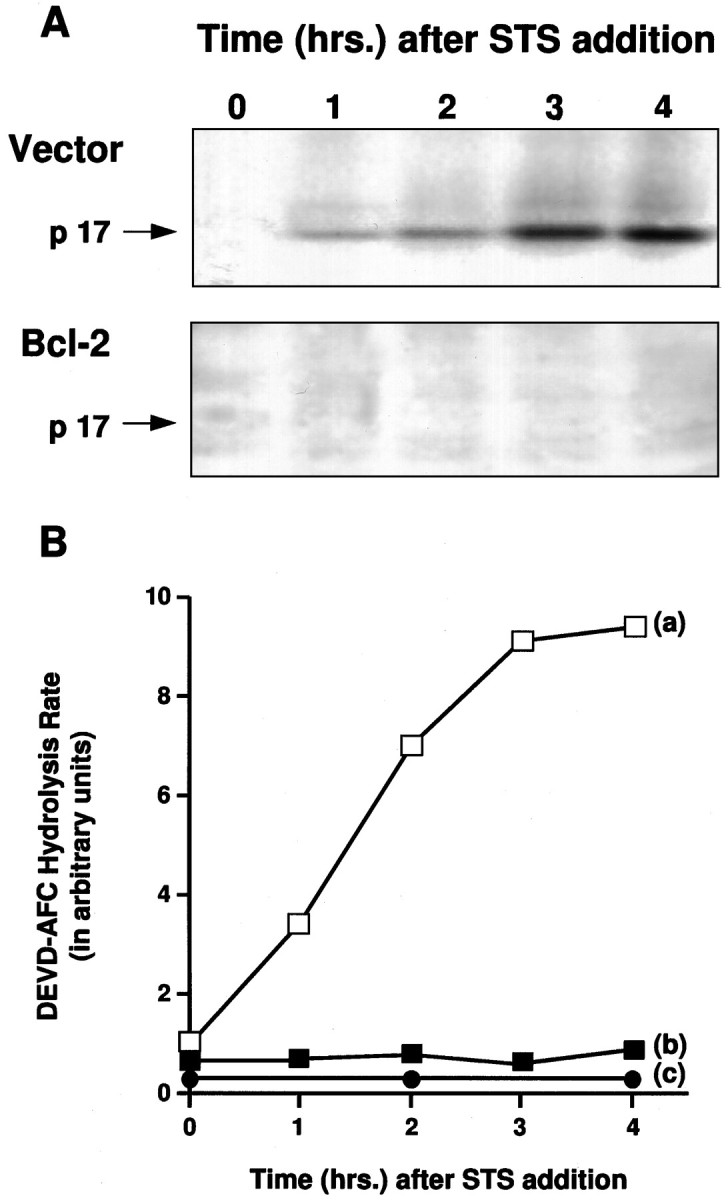
Time course of p17 induction and DEVD-AFC hydrolysis during apoptosis. A, Western blot of BIN-labeled cell extracts from vector control and Bcl-2-overexpressing cells at the indicated times after staurosporine (0.5 μm) treatment. B, ICE/CED-3-like proteolytic activity measured by DEVD-AFC hydrolysis at the indicated times after staurosporine (0.5 μm) treatment. a, Vector control cells; b, Bcl-2-overexpressing cells;c, extracts from staurosporine-treated vector control cells preincubated with VAD-FMK (100 μm, 15 min) before measurement of DEVD-AFC hydrolysis rates.