
Fig. 10.
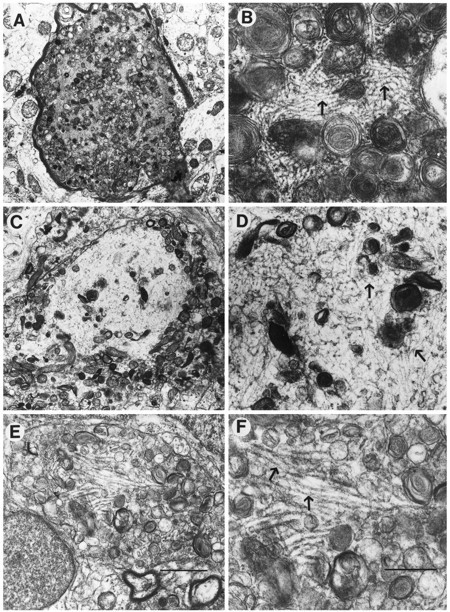
Comparison of cytoskeletal alterations between the PDAPP tg mouse and AD. Low-power (A) and high-power (B) views of a myelinated dystrophic neurite in the PDAPP tg containing abundant laminated bodies and filamentous material (10 nm in diameter; arrows). Low-power (C) and high-power (D) views of a dystrophic neurite in AD containing multilaminar bodies and neurofilamentous material similar to the one observed in the PDAPP mouse (arrows). Low-power (E) and high-power (F) views of a dystrophic neurite in AD containing classical paired helical filaments (arrows). Scale bars: E, 5 μm;F, 200 nm.