
Fig. 5.
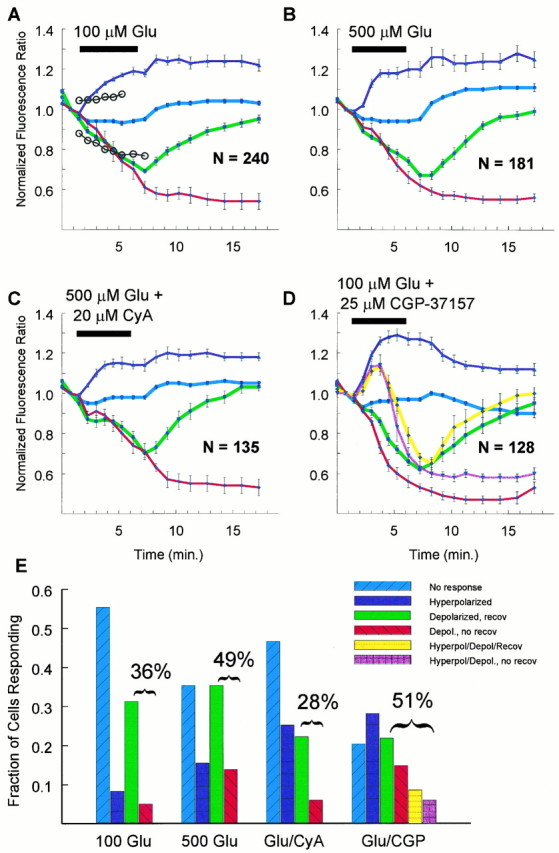
Distinct mitochondrial responses to excitotoxic glutamate stimulation. The data were collected and sorted as described in Materials and Methods. For each of the respective categories, data are plotted as mean and SEM. A, Two hundred forty neurons were stimulated with 100 μm glutamate (Glu) and 1 μm gly. This panel illustrates the “criteria” described in Materials and Methods as open circles. Any neuron that deviated above orbelow the circles would be separated out of the nonresponding (blue line) group and into one of the other three categories. B, One hundred eighty-one neurons were stimulated with 500 μm Glu and 10 μm gly and segregated. C, One hundred thirty-five neurons were stimulated with 500 μm Glu and 10 μm gly in the presence of 20 μmcyclosporin A and categorized. D, One hundred twenty-eight neurons were stimulated with 100 μm Glu and 1 μm gly in the presence of 25 μmCGP-37157, an inhibitor of mitochondrial Na+/Ca2+ exchange. This panel is particularly complex because the combined Glu + CGP-37157 treatment resulted in some cells demonstrating an increase that was followed by a decrease in mitochondrial membrane potential. The two extra linesand bars (in E) reflect this additional level of complexity. E, For each set of averaged responses, the corresponding set of bars illustrates the relative frequency of the particular response. For 100 μmGlu alone, 36% of the cells met the criteria for mitochondrial “depolarization” (sum of green and red bars), whereas only 10% met the criteria for an increase in mitochondrial membrane potential (purple bar); most of the cells with depolarized mitochondria recovered (green bar). With 500 μm Glu alone, 49% of the mitochondria of the cells underwent depolarization, and 19% increased their membrane potential (purple bar); here, 15% of the cells whose mitochondria depolarized never recovered (red bar). When neurons were treated with 500 μm Glu in the presence of cyclosporin A, only 28% of the mitochondria of the neurons depolarized, whereas 29% displayed an increased membrane potential (purple bar); as with 100 μm Glu alone, most of the neurons recovered (green bar). When CGP-37157 was co-applied with 100 μm Glu, fully 51% of the cells had depolarized mitochondria (sum of green, red, yellow, andmagenta bars), and 44% of the cells had increased mitochondrial membrane potentials (sum of purple, magenta, and yellow bars). Here, more than half of the neurons whose mitochondria depolarized never recovered (compare sum of green and yellow bar with sum ofred and magenta).