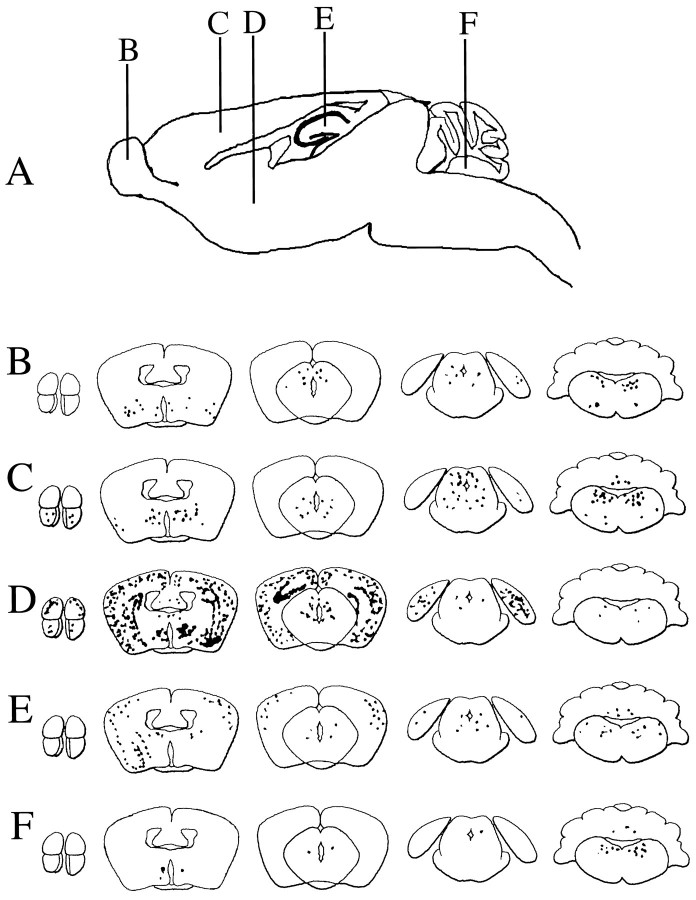
Fig. 5.
Diagrams of the distribution of LAT+cells in the CNS after IC inoculation in different locations. Schematic of the injection sites (B–F in A) and diagrams (B–F) of representative coronal sections of mouse brain showing the distribution of LAT+ cells at day 45 postinoculation of strain 1716 into olfactory bulb (B), cortex (C), caudato-putamen (D), hippocampus (E), and posterior fossa (F).

