Fig. 4.
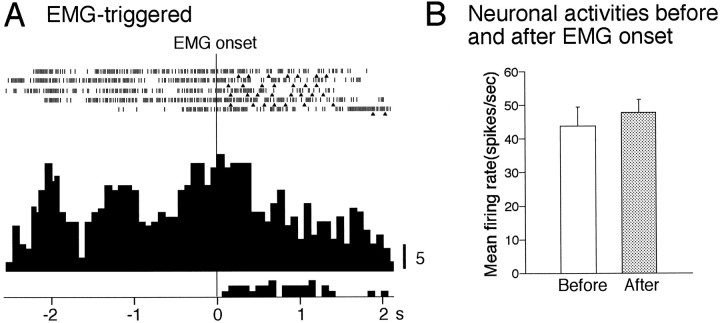
Activity of the conditioned stimulus-related neuron shown in Figure 3. A, Raster displays and accumulated histogram of the discharges of the conditioned stimulus-related neuron during the reward task. Raster displays and the histogram were aligned with the EMG onset. Other descriptions as for Figure 2C. B, Histogram of the mean firing rates for 800 msec before and after the genioglossus EMG onset. Note no significant difference in neuronal activity before and after onset of the genioglossus EMG activity (paired t test,p > 0.05). Other descriptions as for Figure2D.

