
Fig. 3.
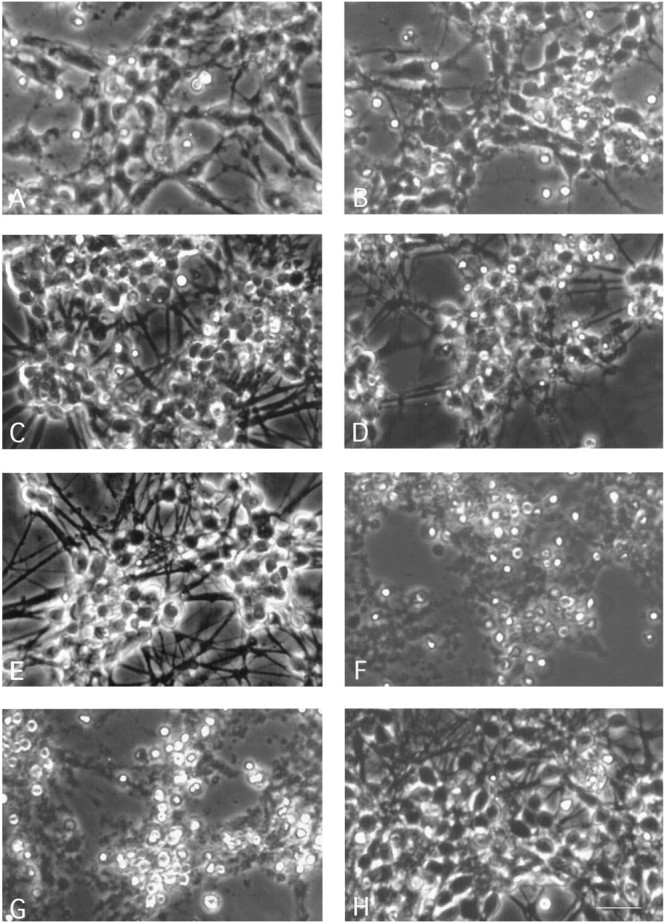
Acceleration of apoptosis by TGF-β2 becomes apparent 24 hr before death of the untreated control cultures maintained in low K+. Phase-contrast microscopy shows that untreated low K+ controls (A) and TGF-β2 (1 ng/ml)-treated cultures (B) are indistinguishable in the first 6 d in vitro. By DIV7, the TGF-β2-treated neurons (D) show patches of dead cells throughout the culture, whereas untreated controls (C) display the macroscopic features of homogeneous and progressive apoptotic degeneration: appearance of apoptotic cell bodies, reduced cell density, and a thinning of the neurite network. On DIV8, TGF-β2-treated neurons (F) are dead compared with untreated low K+ controls (E). On DIV10, apoptotic cell death is completed in low K+ controls (G) compared with neurons maintained in high K+ (H). Magnification, 580×; scale bar (shown in H), 20 μm.