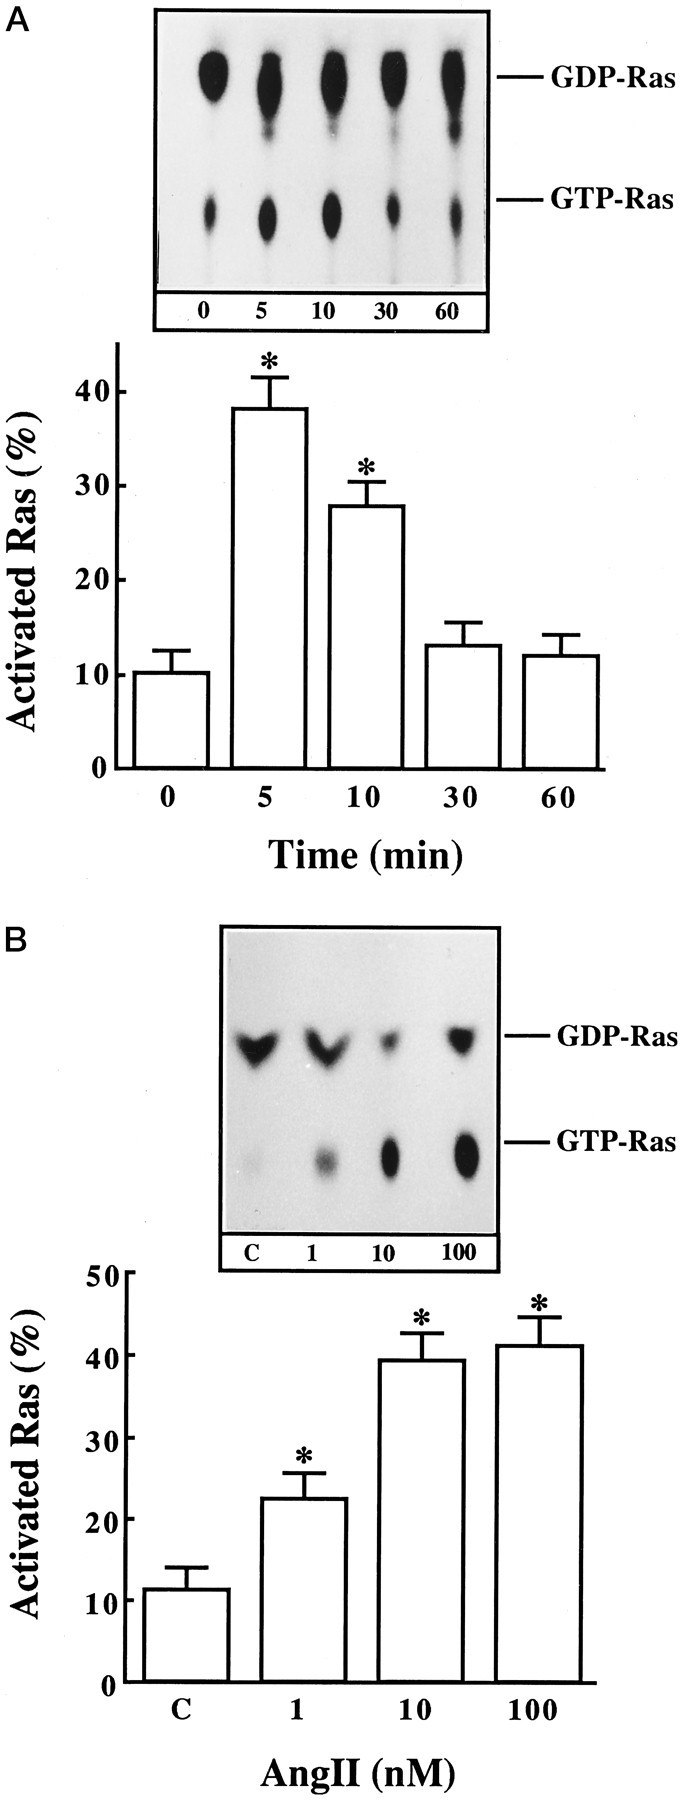
Fig. 1.

The effect of Ang II on activation of Ras in neuronal cultures. Neuronal cultures were incubated with 100 nm Ang II for indicated time periods (A) or with indicated Ang II concentrations for 5 min (B). Levels of GTP-bound Ras and GDP-bound Ras were determined essentially as described in Materials and Methods. Data are presented as activated Ras, which was calculated as a percentage from a ratio of GTP-Ras over GTP-Ras + GDP-Ras. They are mean ± SE (n = 3). Asterisks indicate significantly different from zero time or control (p < 0.05).Insets in both A and B show representative autoradiograms.
