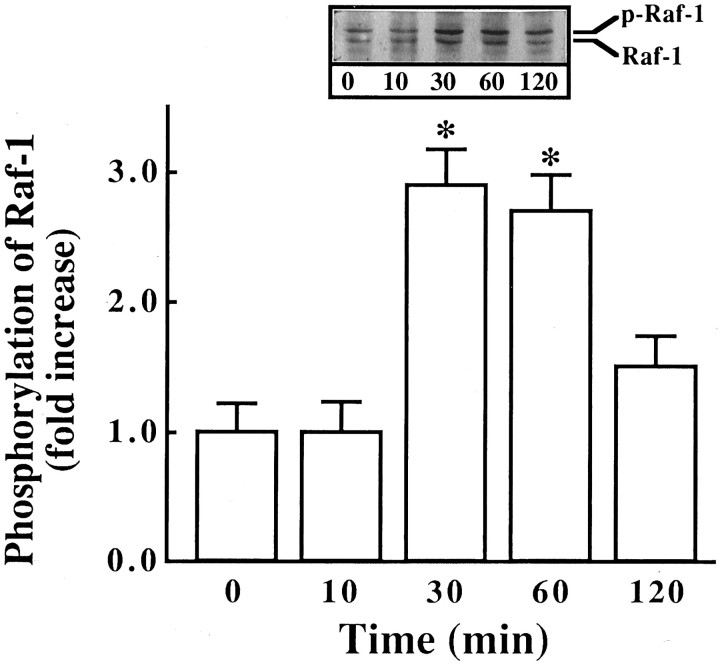
Fig. 5.
Immunoblot of Raf-1 stimulated by Ang II in neuronal cultures. Experimental protocol was essentially the same as described in the legend to Figure 3. Immunoblots were developed essentially as described in Materials and Methods. Top, Representative autoradiogram. Bottom, Bands corresponding to phosphorylated Raf-1 (p-Raf-1) were quantitated, and data from three immunoblots were presented as mean ± SE.Asterisks indicate significantly different from the zero time density (p < 0.05).

