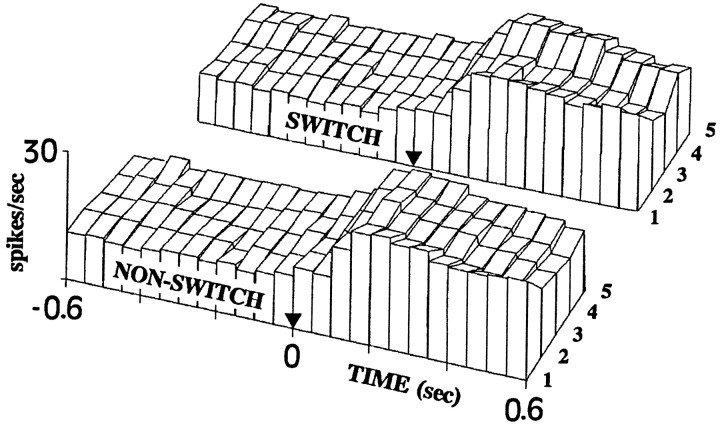
Fig. 7.
Three-dimensional surface map of PSTHs to the five presentations of the experimental images. Histograms forming the map represent averaged (across all cells and images) frequency of spikes (in spikes/sec) in 50 msec time bins. There is a decrease of cell activity with repetition and a rebound from this decrement in the switching condition. Cell activity to the first presentation after the viewing eye is switched (4) returns to the level of a new presentation (1).

