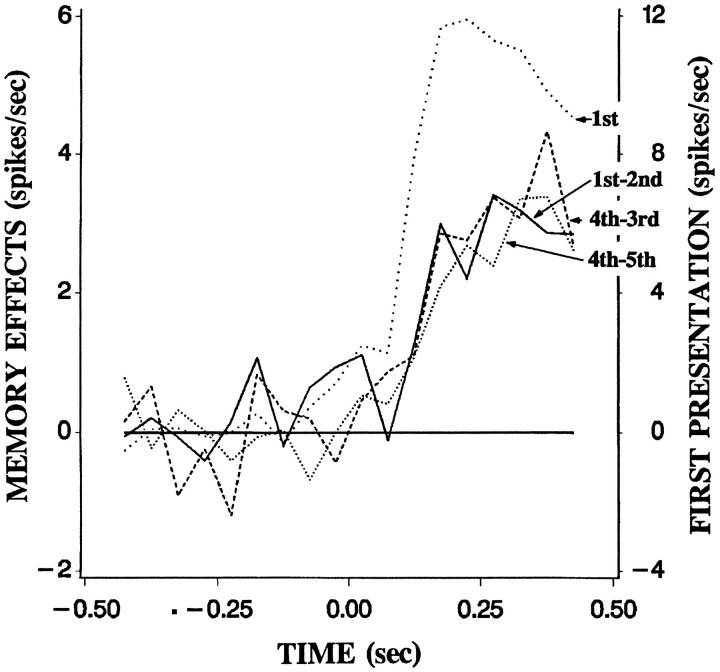
Fig. 8.
Population average of unit activity evoked by the first presentation of the experimental images (dotted linelabeled 1st, referred to the right-hand scale) and the three measures of memory (referred to the left-hand scale). Thecontinuous line depicts initial memory, the difference in frequency of spikes between the first and second presentation. Thebroken line depicts the rebound from memory, the difference between the fourth and third presentation. The dotted linedepicts the memory after rebound, the difference between the fifth and fourth presentation. Averaged data from all cells in 50 msec time bins in the switching condition are shown.

