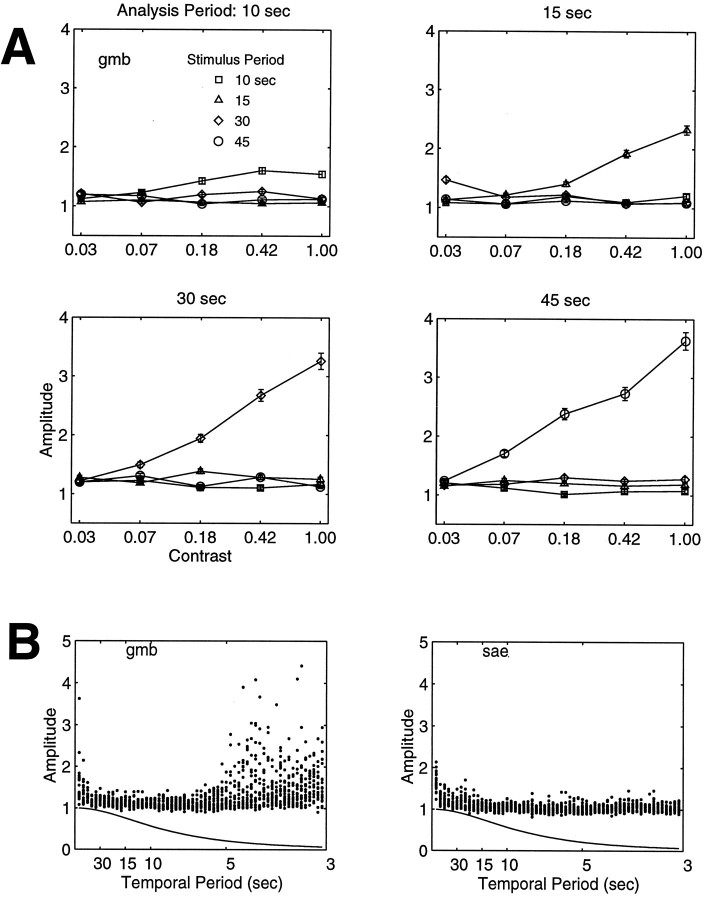
Fig. 9.
Noise analysis. A, fMRI response amplitudes for periodic stimuli as a function of stimulusContrast, stimulus Temporal Period, andAnalysis Period. Each panel corresponds to a different analysis period. Different curves correspond to different stimulus temporal periods. Error bars represent 1 SE. Response amplitude increases with Contrast only when the Analysis Period is the same as the stimulus Temporal Period. The other curves are measurements of the noise. The noise curves are flat, demonstrating that the noise is independent of both stimulus contrast and stimulus temporal period. B, Noise amplitudes for all periodic stimulus conditions and for all possible analysis periods. The noise is broad-band; that is, the noise amplitudes are significantly nonzero for each of the analysis periods. The solid curve, drawn for comparison, is the temporal fMRI frequency–response function, that is, the amplitude of the Fourier transform of the temporal fMRI impulse–response function (from Fig. 13).

