
Fig. 2.
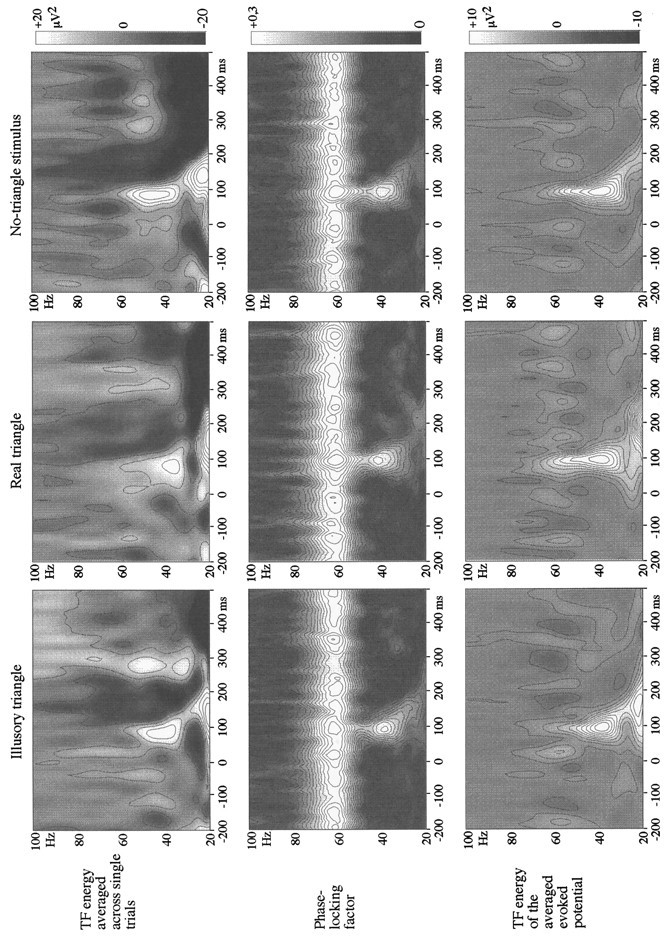
Time–frequency analysis at electrode Cz, grand average across subjects. Top row, TF energy averaged across single trials. This type of averaging sums phase-locked as well as non-phase-locked activities. Results are baseline-corrected (subtraction of the prestimulus levels in each frequency band), thus producing positive and negative values. Two successive increases of TF energy can be observed: a first one around 90 msec and a second one around 280 msec. Middle row, Phase-locking factor. The first gamma-band component (90 msec) is phase-locked to stimulus onset, whereas the second one (280 msec) disappears: it is not phase-locked. Data are not baseline-corrected: the artifact created by our video monitor, therefore, is prominent (continuous component at 62 Hz, video frame rate). Bottom row, Baseline-corrected TF energy of the averaged evoked potential. Only phase-locked components of the response can be seen, but with a better signal-to-noise ratio. There are no TF energy differences between stimulation types for the 40 Hz, 90 msec component.