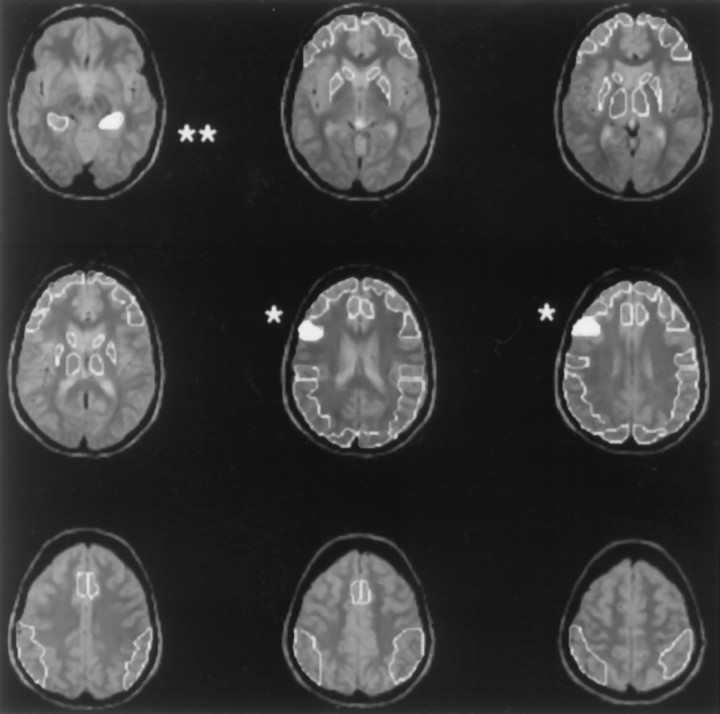
Fig. 1.
An example of the individualized ROI templates that were drawn on the MRI of each subject. Locations of regions in which overall repeated-measures ANOVA (Drug × Task interaction) reached statistical significance are shown in solid whiteand are indicated by asterisks. For statistical analysis, area-weighted averages were calculated across several slices for like structures including (1) superior portion of the inferior frontal gyrus in slices indicated by a single asterisk, and (2) hippocampal area in the slice indicated by a double asteriskand in the next most inferior slice (data not shown).

