
Fig. 2.
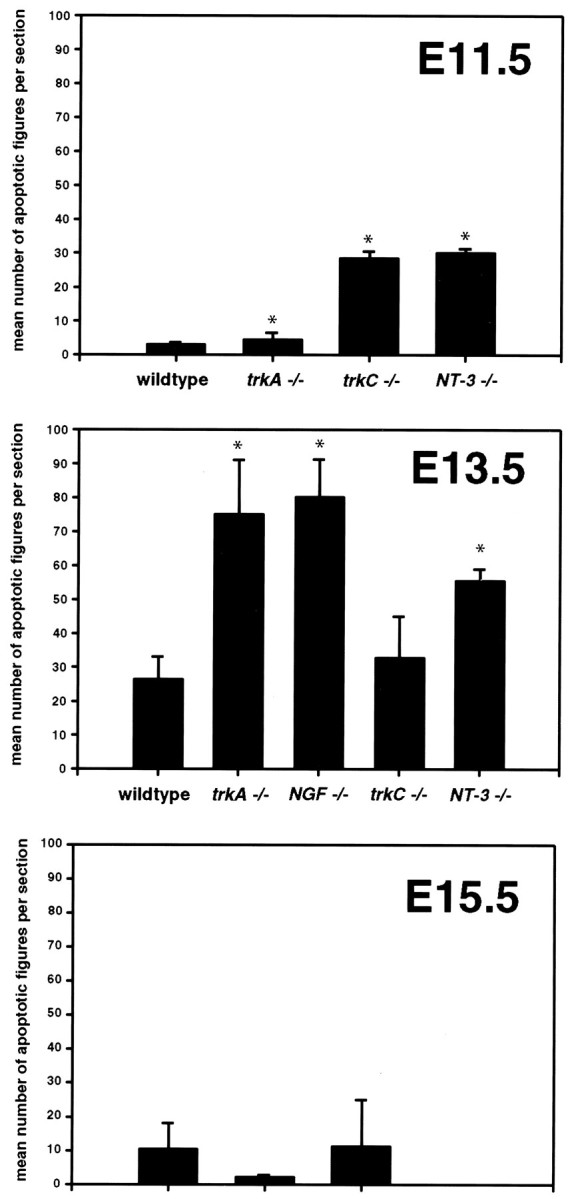
Mean numbers of apoptotic figures per section at E11.5, E13.5, and E15.5 in WT and null mutant mice.Asterisks denote significant differences from WT mice.
Official websites use .gov
A
.gov website belongs to an official
government organization in the United States.
Secure .gov websites use HTTPS
A lock (
) or https:// means you've safely
connected to the .gov website. Share sensitive
information only on official, secure websites.
Mean numbers of apoptotic figures per section at E11.5, E13.5, and E15.5 in WT and null mutant mice.Asterisks denote significant differences from WT mice.