
Fig. 4.
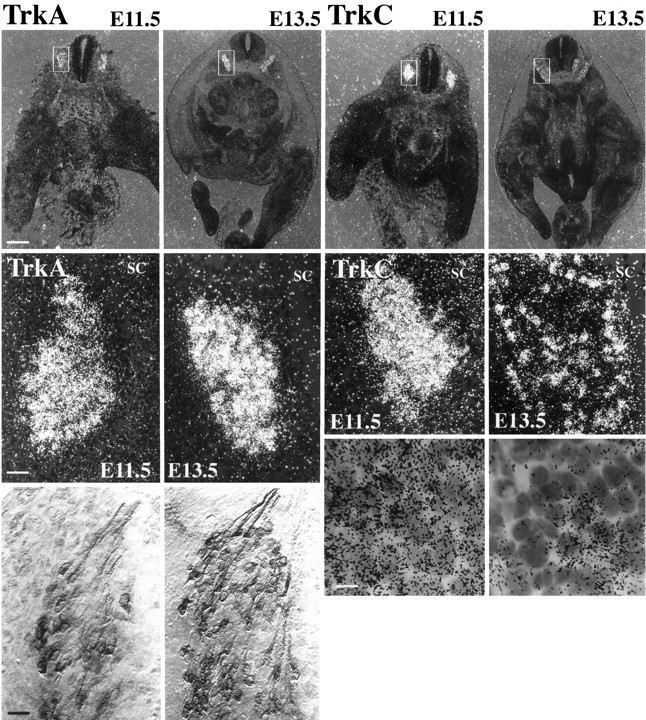
TrkA and TrkC expression in lumbar DRGS at E11.5 and E13.5. Left, TrkA (top), Low-power dark-field photomicrographs of transverse sections through the hindlimb region at E11.5 and an E13.5 hybridized with antisense TrkA riboprobe.Dashed box shows DRG. Note that expression is already apparent at E11.5 and increases by E13.5. Scale bar, 500 μm.Middle, Higher power of box shows that most DRG cells express TrkA at E11.5 and E13.5 and that mRNA levels increase between the two time points. SC, Spinal cord. Scale bar, 100 μm.Bottom, Bright-field photomicrographs (Nomarski) of TrkA immunoreactivity. Many DRG cells clearly express TrkA protein as early as E11.5. Scale bar, 100 μm. TrkC (top), TrkC mRNA is intensely expressed by DRG cells at E11.5. In striking contrast to the pattern for TrkA expression, TrkC mRNA is downregulated by most DRG cells between E11.5 and E13.5. Middle, Higher magnification of boxed regions demonstrates downregulation of TrkC by many DRG cells. Bottom, 100× bright-field photomicrographs show that >80% of DRG cells express TrkC at E11.5, whereas only a minority express TrkC at E13.5. Scale bar, 40 μm.