
Fig. 9.
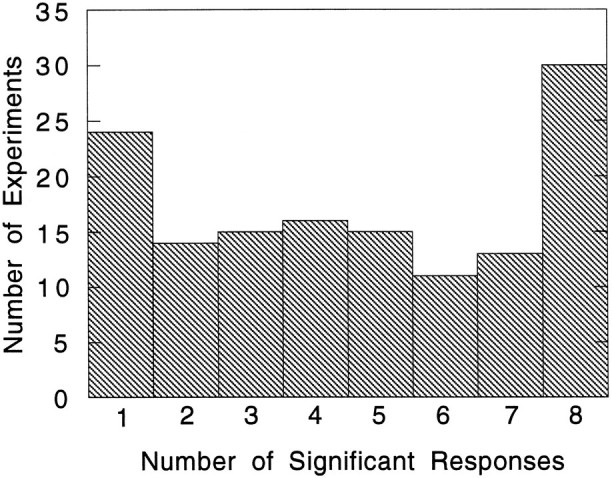
Histogram breaking down the Tuned category of experiments according to the number of motion types for each experiment producing a significant response. Note the large number of experiments for which multiple motion types produced a significant response.