
Fig. 4.
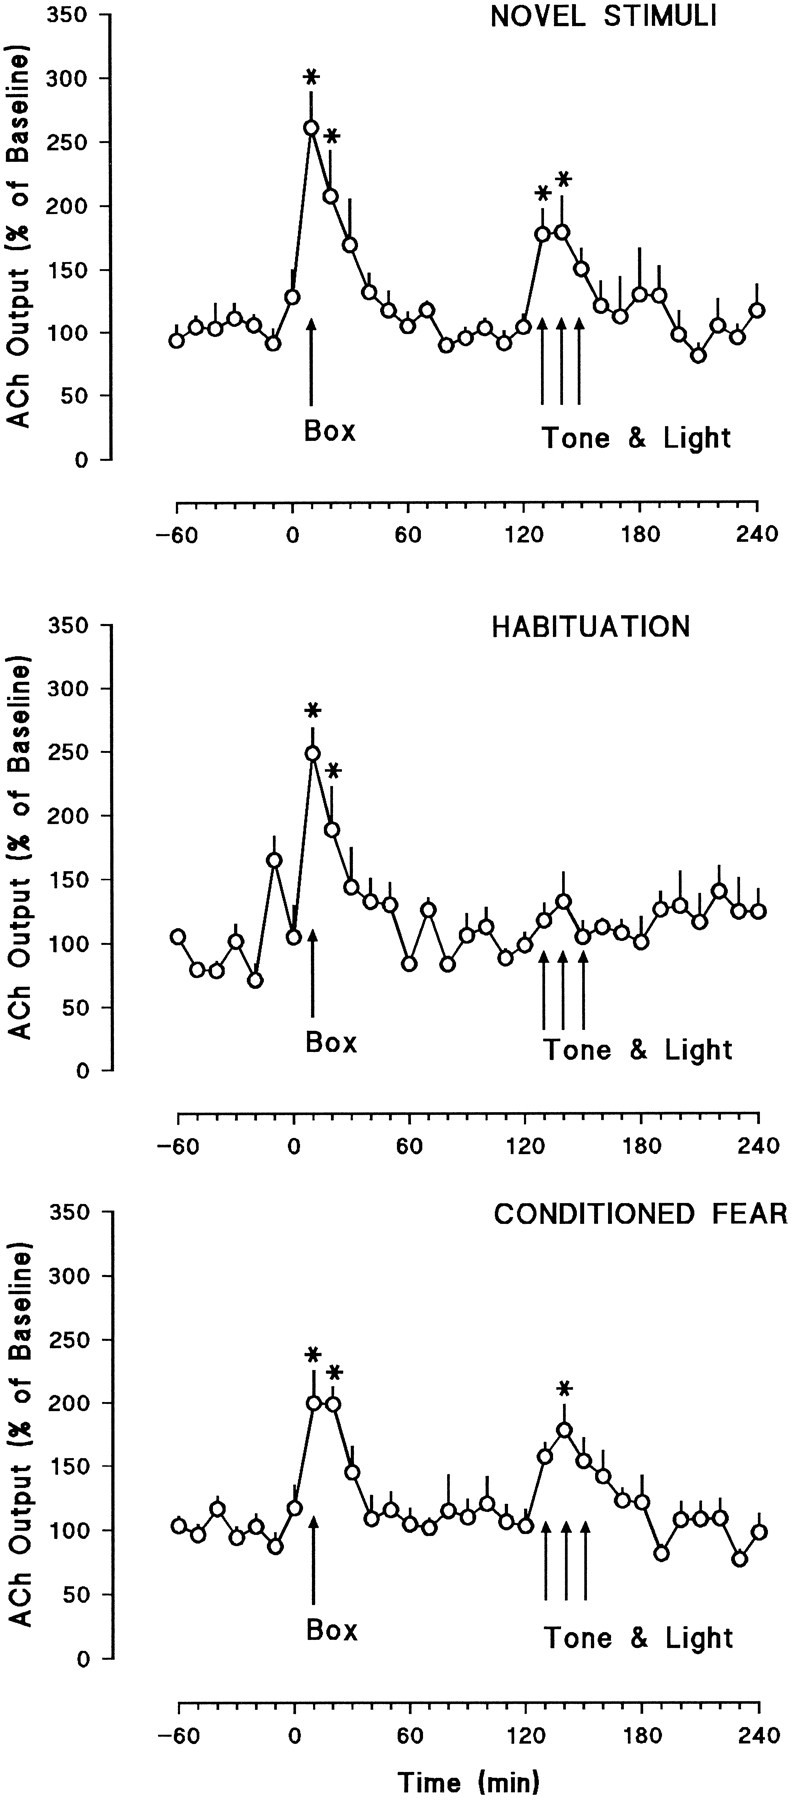
Hippocampal dialysate concentrations of ACh expressed as the percent change from the average of the last six baseline values + SEM. The Box arrows indicate the time at which the rats were moved from the dialysis cage (baseline) into the test chamber. The Tone & Lightarrows indicate the 30 min period during which the auditory and visual stimuli were presented. The top panel shows results from the novel stimuli group (n = 6), and themiddle and bottom panels show the habituation (n = 6) and conditioned fear groups (n = 8), respectively. Asterisks indicate significant difference from baseline, p < 0.05.