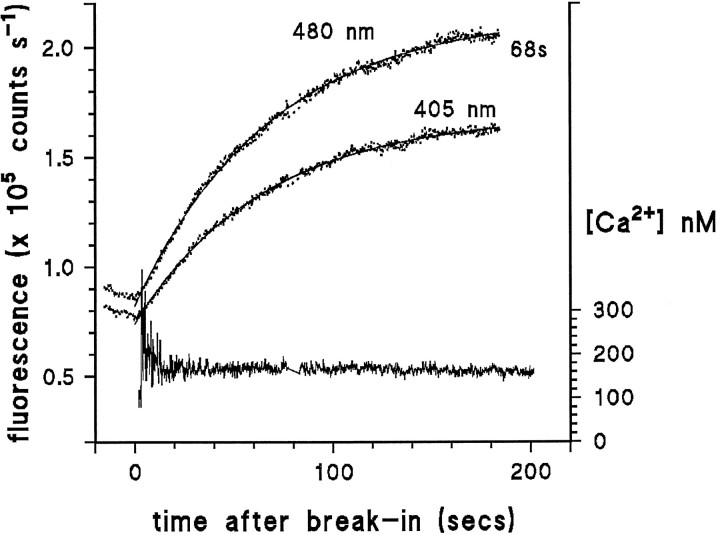
Fig. 2.
Time course of dye loading in an oraphotoreceptor. Raw traces (dotted) show the INDO-1 fluorescence measured at 405 and 480 nm starting shortly after making a giga-seal. After establishing the whole-cell configuration (at time 0), fluorescence rises with a single exponential time course (smooth curves, single exponential fits to the traces with time constant of 68 sec). After subtraction of the background fluorescence, the ratioR between fluorescence at 405 and 480 nm was used to calculate cytosolic [Ca2+] according to Equation 1. Cytosolic [Ca2+] remained stable throughout the 200 sec recording, except for an apparent reduction during the first few seconds of recording. Recording made in normal (1.5 mm Ca2+) Ringer’s at −70 mV, briefly interrupted at ∼80 sec, for visual inspection of cell.

