
Fig. 4.
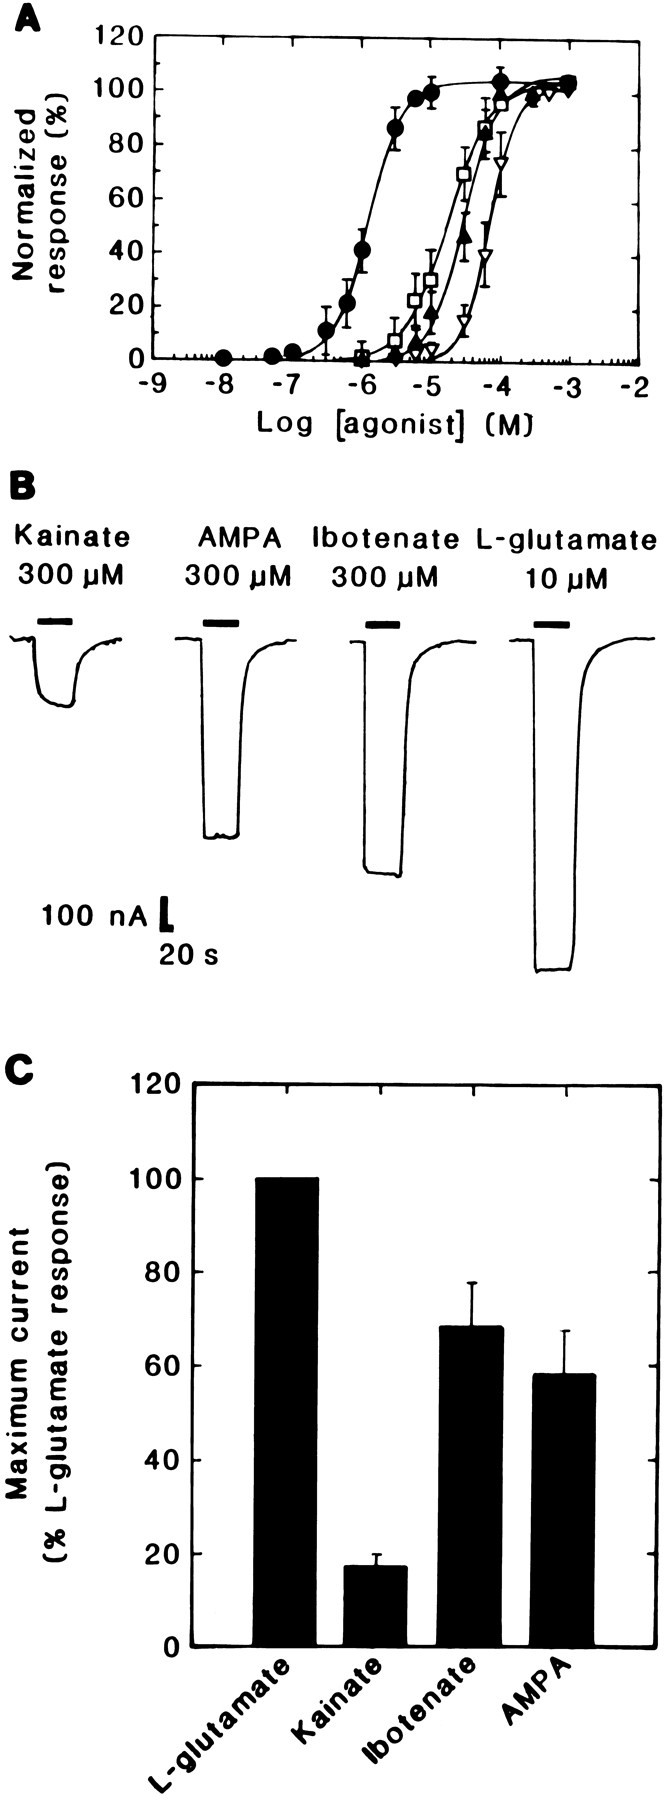
Agonist pharmacology of Lym-eGluR2 channels expressed in Xenopus oocytes. A, Dose–response curves for l-glutamate (filled circles), kainate (open squares), ibotenate (filled triangles), and AMPA (inverted open triangles). Each curve was determined on several oocytes (for glutamate, n = 12; for kainate, n = 12; for ibotenate, n = 10; and for AMPA, n = 12). Each point represents the mean ± SD. Note that the response to each concentration of a given agonist was normalized to the maximal response (denoted as 100%) to that ligand. B, Selected traces of responses evoked by maximally effective concentrations of various glutamatergic agonists (Kainate, 300 μm; AMPA, 300 μm; Ibotenate, 300 μm; l-glutamate, 10 μm) on a single oocyte 6 d postinjection.Downward deflections denote inward currents andhorizontal bars indicate the duration of agonist application. C, A bar graph showing the efficacies of various glutamatergic agonists. All agonists were tested at their maximally effective concentrations on the same oocyte 5 d postinjection. In this case, all responses were normalized to the average peak current elicited by 10 μml-glutamate; the bars represent the mean ± SD of between 4 and 10 experiments. The concentrations of agonists used were: l-glutamate, 10 μm; Kainate, 300 μm; Ibotenate, 300 μm; AMPA, 300 μm; these were applied with a 10 min interval between applications.