
Fig. 2.
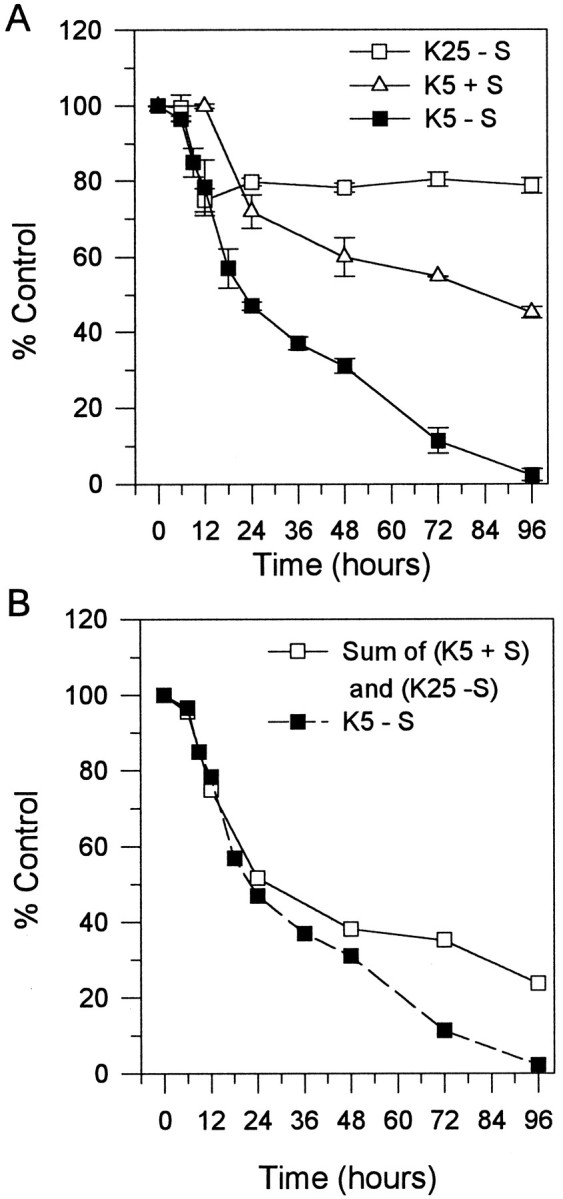
Time course of loss of viability after removal of serum alone or potassium alone. A, Cultures were switched to either K5 + S, or K25 − S medium for 12, 24, 48, 72, or 96 hr and counted by staining with calcein AM, as described in Materials and Methods. Open squares and open triangles represent the time course of loss of viability after switching cultures to K25 − S, K5 + S, respectively.Closed squares represent K5 − S time course, as presented in Figure 1A. Data represent the mean ± SEM of four independent experiments for K25 − S and the mean ± range of two independent experiments for K5 + S.B, Open squares represent the percentage of dead cells from the K5 + S time course summed together with percentage of dead cells from the K25 − S time course at 12, 24, 48, 72, and 96 hr. Closed squares represent K5 − S time course, as presented in Figure 1A.