Fig. 1.

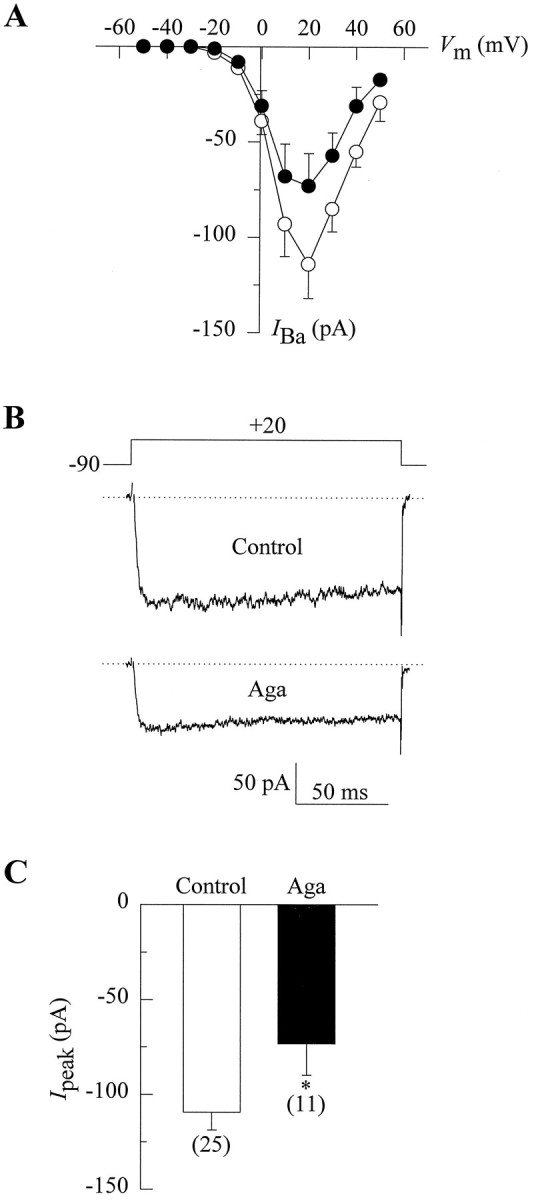
Voltage dependence of Ba2+ current in PC12 cells and its inhibition by ω-Aga-IVA. A, Peak current–voltage relationships obtained from two groups of cells after 30 min incubation in the absence (open circles) or presence of 200 nm ω-Aga-IVA (filled circles). The currents were recorded in response to 150 msec depolarization from a holding potential of −90 mV with 10 mV increase in the pulse amplitude per step. Symbols represent mean peak current values of sham preincubated (n = 9) and toxin-treated cells (n = 11). B, Illustrative traces of peak inward current from a control (upper trace) and an ω-Aga-IVA-treated (lower trace) cell. The voltage protocol is shown above the traces, and the dotted line represents baseline current.C, Comparison of peak current amplitudes at +20 mV in both control and ω-Aga-IVA-treated cells. Data are given as mean ± SE, and the number of recorded cells is indicated inparentheses. Asterisks denote significant differences (p < 0.05).
