Fig. 2.

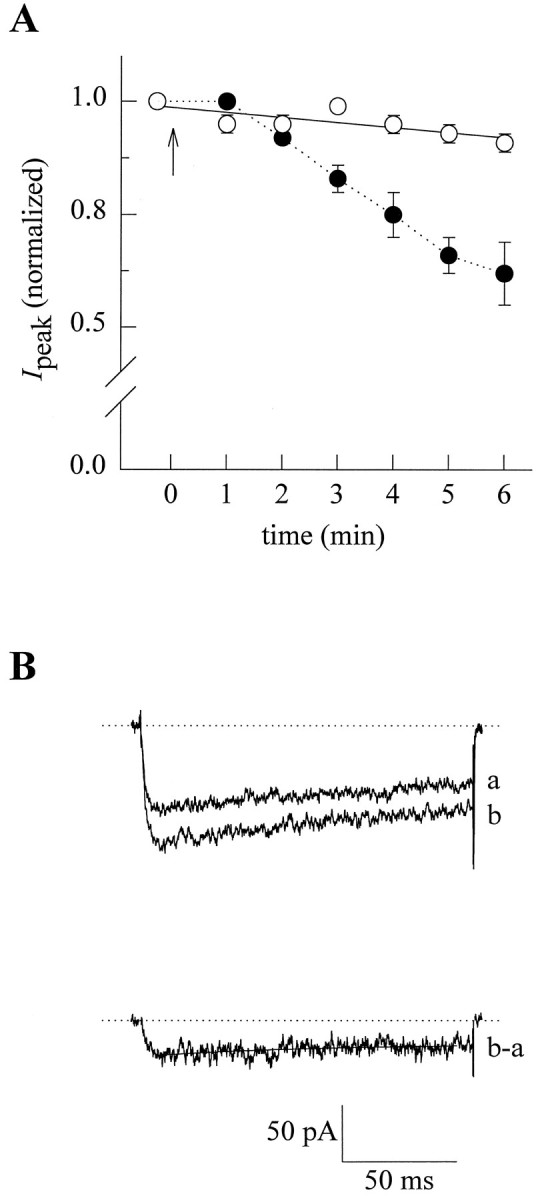
Properties of the ω-Aga-IVA-sensitive Ca2+ channel current in PC12 cells. A, Plot of peak IBa versus time in which recordings were sequentially taken before and after ω-Aga-IVA application.Filled circles represent average current blocked by the toxin (n = 5). Currents were obtained by applying 150 msec steps from −90 to +20 mV, and peak currents were normalized by the values observed before toxin application. Arrowindicates ω-Aga-IVA addition. Open circles denote time-dependent changes in the amplitude of the current (rundown) in control cells, and the straight line represents the best fit to the data. B, Representative superimposed traces of Ba2+ currents taken from one of the cells indicated inA, before (b) and 6 min after exposure to 200 nm ω-Aga-IVA (a). Lower trace exemplifies the currents (b-a) obtained by subtracting the current in the absence and in the presence of the toxin and represents the ω-Aga-IVA-sensitive component. The inactivation phase of these currents was fitted with a single exponential (solid line).
