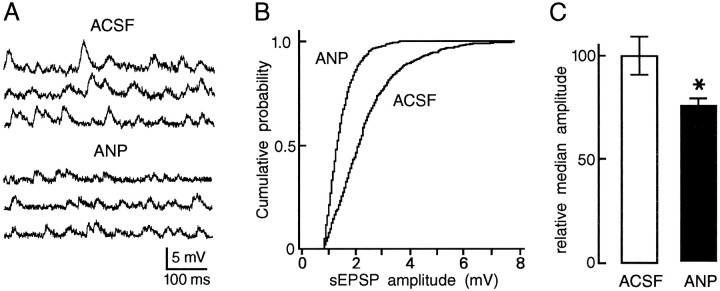
Fig. 3.
Effects of ANP on the amplitude of sEPSPs.A, High-gain voltage excerpts of a recording obtained from a rat MNC in control solution (ACSF) and in the presence of ANP (75 nm). The membrane potential was −63 mV. B, The graph plots the cumulative probability distributions of sEPSP amplitude measured from a different MNC during 60 sec recording segments obtained in ACSF (899 events) and in the presence of 75 nm ANP (809 events).C, Bar histograms plot the mean (±SEM) relative median amplitude (normalized amplitude at 0.5 probability) of the sEPSPs observed in control solutions (ACSF; 100%) and in the presence of 75 nmANP (theasterisk denotes p < 0.01;n = 5).

