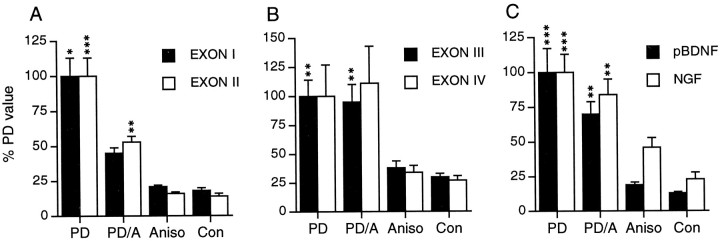
Fig. 6.
Quantification of afterdischarge-induced changes in the expression of the different BDNF transcripts and of NGF with and without anisomycin treatment. Bar graphs show measures of BDNF and NGF cRNA in situ hybridization labeling of stratum granulosum in tissue sections from unstimulated control rats (Con) and rats receiving a PD alone (PD), a PD applied in the presence of anisomycin (PD/A), and anisomycin alone (Aniso) (phase II set). Values represent group means ± SE for n ≥ 7 per group and are expressed as a percent of the maximal labeling density measure, which for each cRNA, was obtained in the PD-alone group. Statistical analyses conducted using raw density measures. Treatments induced significant changes in hybridization density for each cRNA (p < 0.0002 for pBDNF, NGF, exon II, and exon III cRNAs; p < 0.02 for exon I; andp < 0.05 for exon IV; ANOVA main effect of treatment). Asterisks indicate significant differences from control values (***p < 0.001; **p < 0.01; *p < 0.05; Student–Newman–Keuls post hoc test). See text for significance values of additional paired comparisons.

