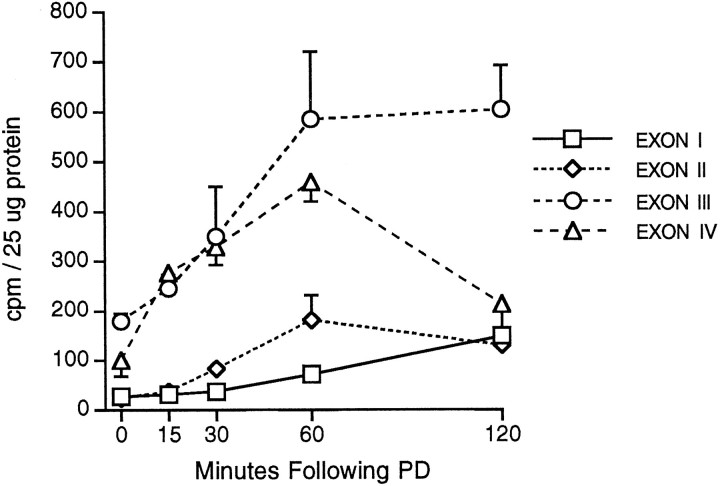
Fig. 7.
BDNF transcripts are increased by different time courses after one afterdischarge. Line graph showing the densities ofin situ hybridization labeling of stratum granulosum with cRNAs for BDNF transcripts containing exons I–IV in rats killed at a range of time points after the stimulation of a single PD. Each point represents the mean ± SE from n ≥ 3 per group. See Results for statistical analyses.

