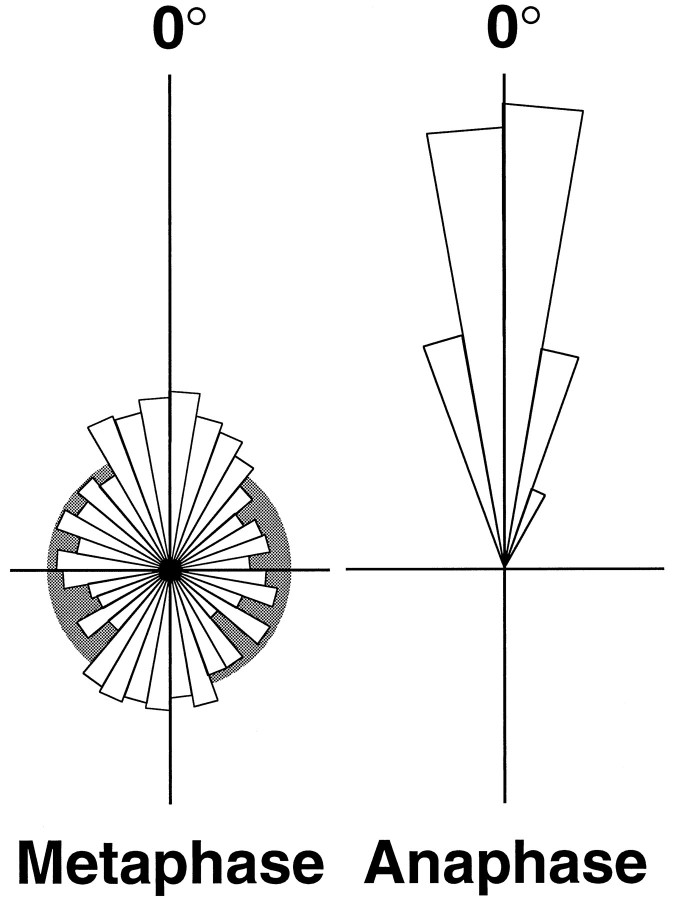
Fig. 5.
Frequency distributions of orientations of spindles in anaphase and metaphase relative to the orientation of division. The orientations measured over time for a population of 24 dividing cells were individually normalized to their mean orientation during anaphase. Measurements were separated into two groups corresponding to those after the onset of anaphase and those preceding them, during metaphase. Each data set was binned at 10° intervals and presented as a rose diagram. The area of each sector is proportional to its frequency (radius proportional to the square root of frequency) such that the total areas of the two plots are equal. The distribution of 591 measurements of spindles in anaphase shows very little rotational movement. The distribution of orientations during metaphase (1051 measurements) is much broader, reflecting the extensive motion of the metaphase spindle. There are two major peaks in this distribution, one at 2.7°, parallel to the mean angle after the cessation of rotation, and the other at 179.6°. This shows that the spindles spend significantly more time aligned in this axis within the plane of the tissue than at angles perpendicular to it. The metaphase distribution is superimposed on the distribution (gray) that would be expected for a uniform (random) distribution of orientation.

