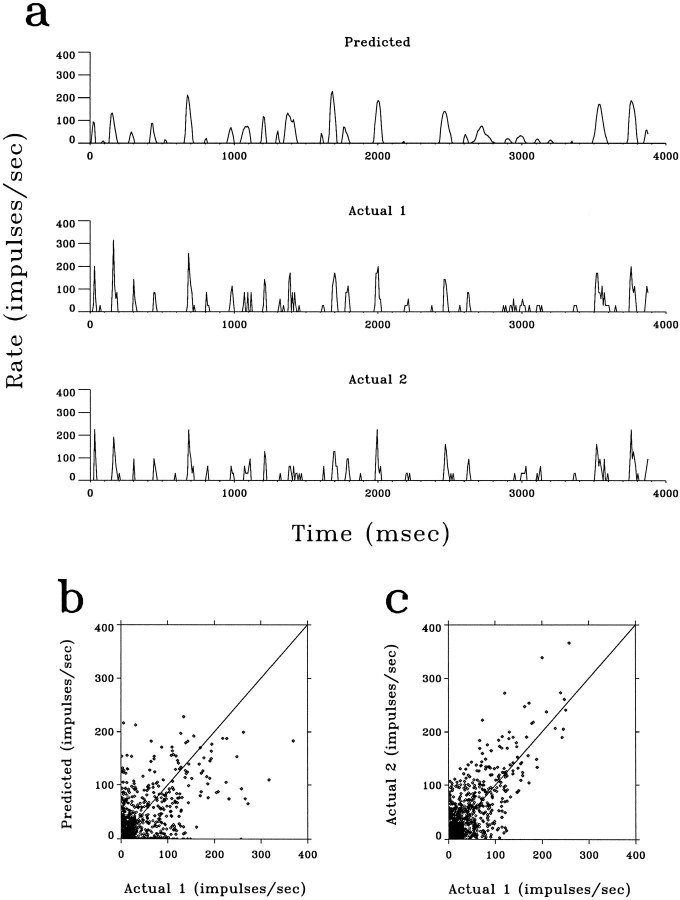
Fig. 7.
Comparison of the predicted and theactual responses to a natural movie. a, Top trace, The predicted response of an X-cell to a movie, as calculated by convoluting the movie with the spatiotemporal receptive field of the neuron, with a subsequent rectification.Middle trace, The actual firing rate of the same neuron in response to the movie, as averaged from the responses to one set of repeats: 1, 3, 5, 7. Bottom trace, Theactual response averaged from the other set of repeats: 2, 4, 6, 8. b, The predicted (top trace in Fig.7a) versus the actual response (middle trace in Fig. 7a, Actual 1) at corresponding temporal frames.c, The response averaged from one set of repeats (2, 4, 6, 8, bottom trace, Actual 2) versus that from the interleaved set (1, 3, 5, 7, middle trace, Actual 1).

