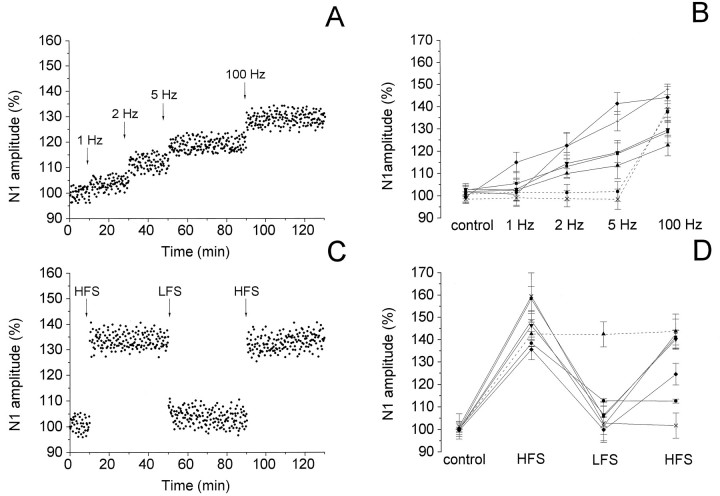
Fig. 2.
Effect of LFS applied before (A, B) and after (C, D) HFS on the N1 wave of the field potentials recorded in the Vp of MVN. A, C, Time course of the effects in a single experiment. In this and in the following figures, the wave amplitude was measured every 15 sec, expressed as a percentage of the baseline and plotted as a function of time. The arrowsindicate the LFS and HFS delivery time. B, D, Effects in 7 of 10 experiments. The points represent the mean amplitude ± SD of the wave evaluated in each experiment within 5 min intervals, expressed as a percentage of the baseline. Dashed lines indicate the cases in which LFS had no effect. The LFS and HFS unaffected cases are not shown.

