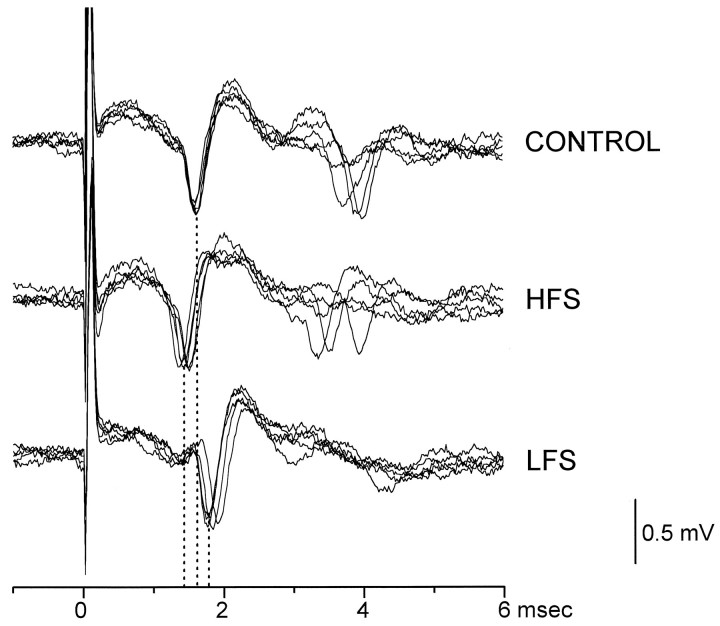
Fig. 5.
Typical effects of HFS and LFS on the peak latency of evoked unitary potentials in the Vp of MVN. The topfive superimposed traces show the potentials recorded before HFS (CONTROL). In the following traces, the potentials were recorded 5 min after HFS (HFS) and 5 min after LFS delivered after HFS (LFS). The dotted lines indicate the shift of the latency (mean values) of the early potential. A similar trend in the latency shift is shown by the late potential. Amplitude and time calibration apply for all recordings.

