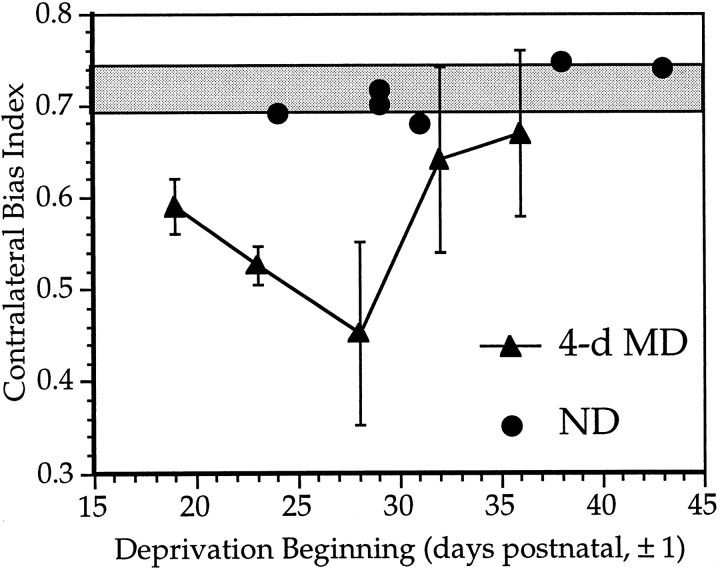
Fig. 4.
Critical period for the effects of monocular deprivation in the mouse. Mean ± SD CBIs for normal animals (shaded bar) and animals monocularly deprived for 4 d beginning at various ages (filled triangles). Filled circles show individual CBIs for OD distributions obtained from ND animals; n = 23–30 cells per hemisphere, N = five hemispheres from five animals per time point (MD) and six hemispheres from five animals (ND).

