
Fig. 9.
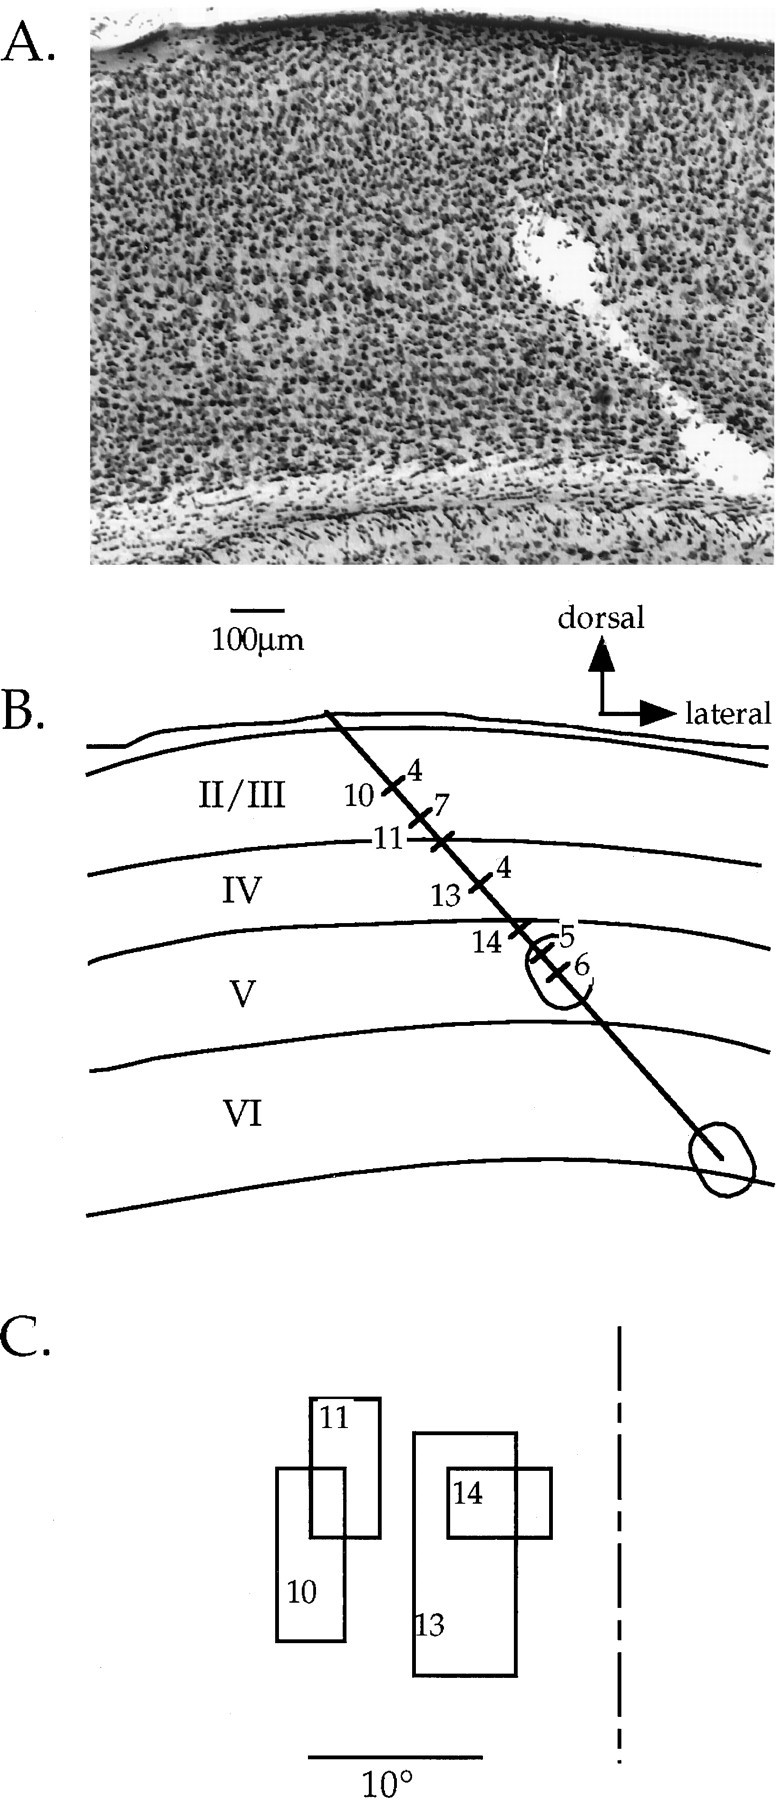
Reconstruction of an electrode track for laminar analysis. A, Nissl-stained section of the visual cortex in a deprived mouse. Two lesions placed at the end of a penetration into the binocular zone can be seen. B, Camera lucida drawing of section shown in A. Laminar boundaries are drawn, as are the lesions and the electrode track. The locations of each cell encountered in the penetration are indicated by hash marks across the electrode track. OD scores are shown to the right of each hash mark for those neurons that could be unambiguously assigned to a cortical layer; numbers to the left of selected hash marks indicated the neurons from which the RFs shown in C were obtained. The scale bar and direction key apply to both Aand B. C, RFs of selected cells obtained in the penetration depicted in A and B. Note that because the electrode penetration was not radial, there was a gradual progression in RF position toward more central locations as the electrode was advanced deeper into the cortex. The vertical meridian is indicated by the dashed line.