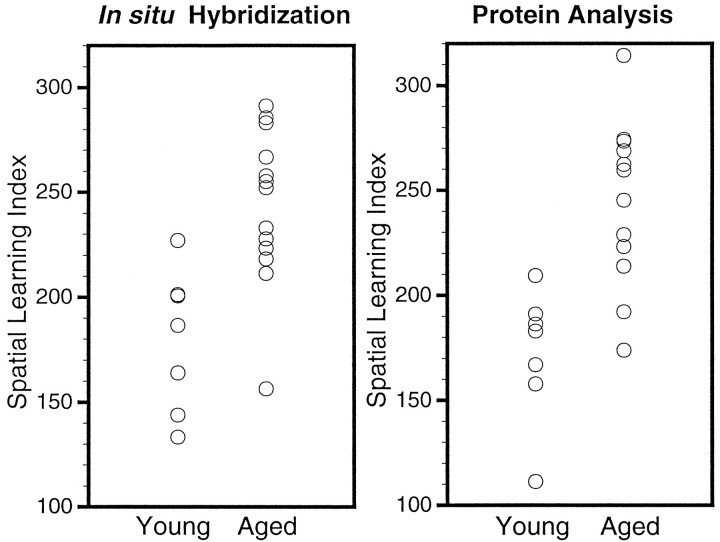
Fig. 2.
Spatial learning indices computed from probe trial performances. The data are plotted as scattergrams, with the data for the young and aged subjects used in the ISHH experiments shown in the left plot, and the data for the young and aged subjects used in the protein immunoblotting experiments shown in the right plot. The y-axes are scales of the learning indices calculated as described in Materials and Methods.

