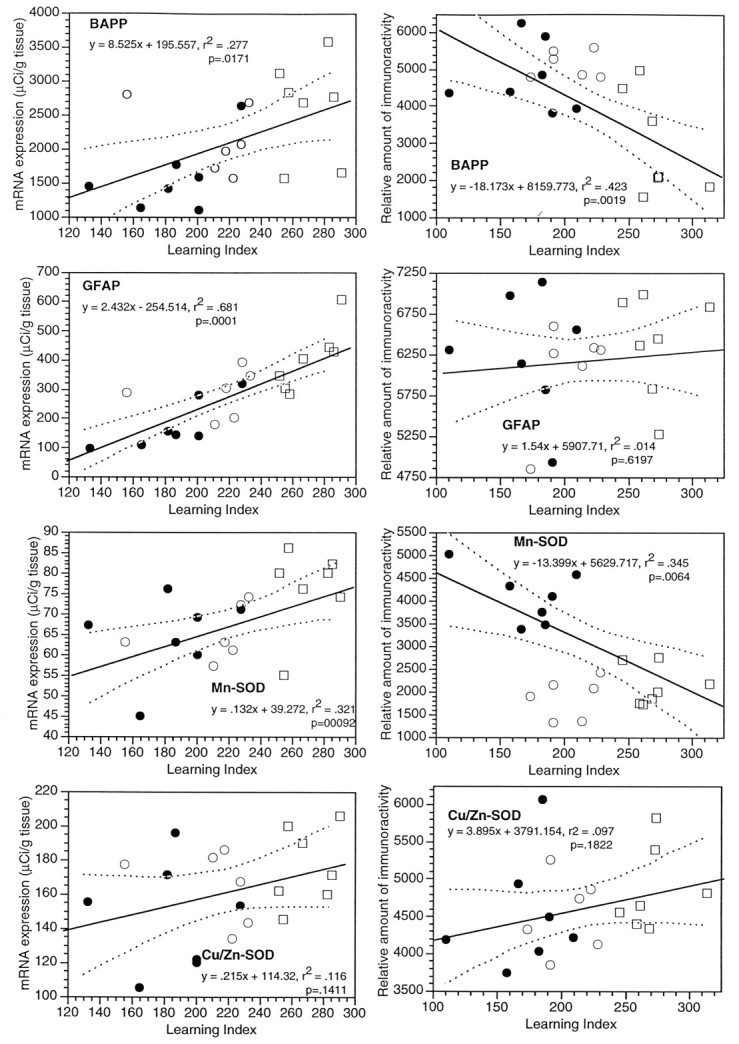
Fig. 4.

Levels of mRNA (left column) and corresponding proteins (right column) in the dorsal hippocampus of young and aged Long–Evans rats, plotted versus the learning index. Twenty rats were used in the ISHH experiments (7 young and 13 aged), and another 20 rats were used for protein analyses. The data for young rats are plotted as filled symbols, and the aged rats are shown as open symbols. The aged subjects are further delineated as “aged-unimpaired” (open circles), or “aged-impaired” (open squares), according to whether their learning index was within the range of the young rats. The mRNA data were sampled using National Institutes of Health Imagefrom scanned film autoradiographs, and each point is the average of levels in the hippocampus for several samples of each subject. The mRNA levels are calibrated according to the tissue equivalents determined from [14C] standards exposed on the films and corrected for film background. The levels of proteins were determined in hippocampal extracts by slot blotting; the levels shown are relative optical densities taken from scanned blots using the program National Institutes of Health Image. Thex-axis is the scale of the learning indices, with better performance in the spatial task at the left end and poorer performance at the right end.
